
Structured products have become a fully-fledged asset class in the French market delivering long-term returns to retail investors across different market environments, as well as beating direct equity holdings, and bond strategies.
The 2019-2020 analysis published by SRP provides an in-depth review of the French structured products market and macro-analysis of 984 products that matured or expired early between 1 April 2019 and 31 March 2020. Of these, 115 reached their maturity date and 869 triggered early maturity.
These figures are impressive – even more so when compared to the negative long-term French interest rates
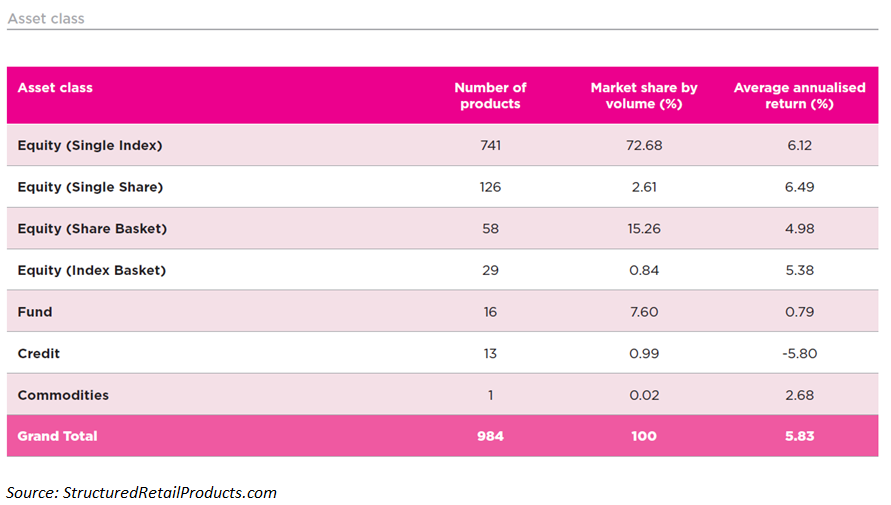
The analysis shows that only 2.2% of the products maturing between April 2019 and March 2020 returned losses, and the average return was six percent pa. for capital-at-risk products and three percent pa. for capital-protected products - the average over the entire sample was 5.83% pa.
“These figures are impressive – even more so when compared to the negative long-term French interest rates,” said Nikolay Nikolov, research executive at SRP. “The drastic drop in risk-free rates on the European markets and the growth for the markets globally in 2019 have further highlighted the appeal of structured products for investors seeking a positive return while staying protected in their exposure to the risky bond market and the unpredictable stock market.”
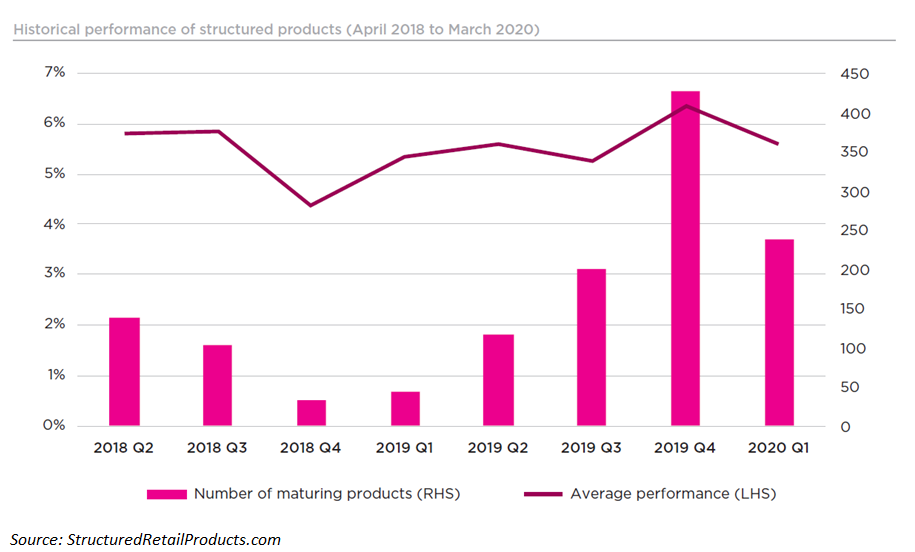
Autocalling products made up 88% of all maturing products in the period, running for an average term of 1.34 years and producing an average annualised return of 6.6%. Nearly two-thirds of all knockout structures (64%) recorded average annualised returns above six percent. The upper quartile returned 7.5% per year, whereas the lower quartile returned 5.3% per year.
“Our analysis shows that, unlike a passive index-based strategy, structured products have delivered steady returns while moderating exposure to excessive fluctuations in volatile markets,” said Nikolov. “This allows investors to know from the start what they can win or lose and avoid uncertainties in sideways markets. In scenarios where equity markets decline, structured products clearly outperform a direct investment, and can limit losses markets are unsettled or investors seek to modulate their equity exposure.”
The analysis shows that structured products have clearly outperformed fixed income alternatives, delivering steady positive performance superior to the performance of both investment-grade and high-yield exchange-traded funds (ETFs) during the period analysed.
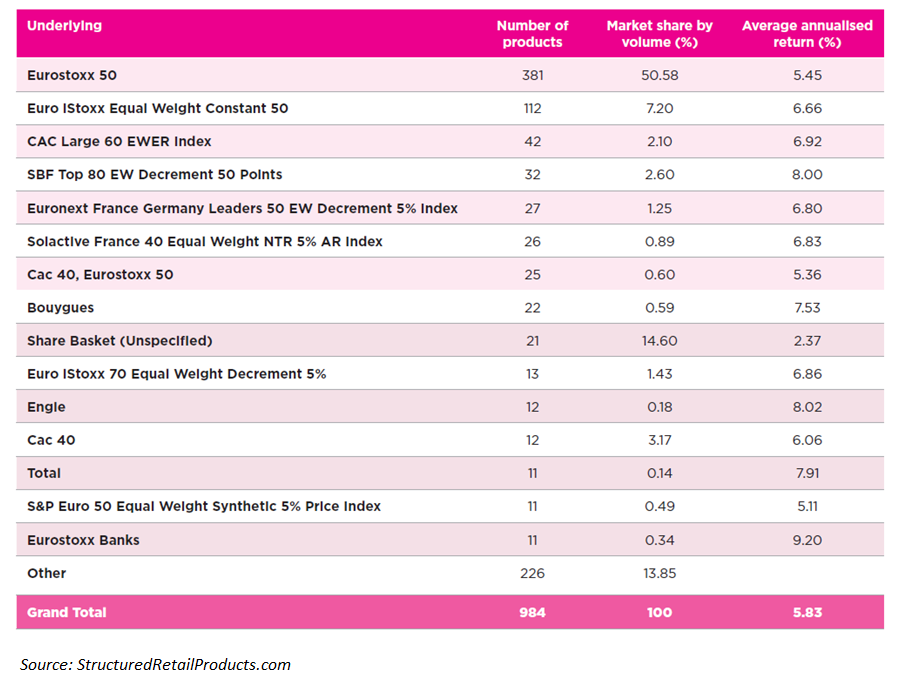
The ability to set protection barriers to reduce risk is one of the most important features of structured products. From the 495 outstanding products linked to the Eurostoxx 50, only one product has not returned to the safety zone as of the end of March 2020 despite the market crash in the same month.
Additionally, only around five percent of the products linked to the four most-used synthetic dividend indices saw their capital protection barriers breached (as of the end of March 2020). “This is a remarkable achievement for all French structured product providers in issuing products with solid protection capable to withstand this year’s turbulent market environment,” said Nikolov.
Structured products have delivered an enhanced regular return compared to bond and fixed income strategies.
Positive returns
French investors have benefitted from structured products during the period analysed as 96% of the structures delivered a positive return at the end of the investment term (two years on average). The upper quartile returned 7.3% per year, whereas the lower quartile returned 4.9% per year. Three quarters of the products returned five percent or more.
Only 2.2% of the products analysed delivered less than the initial capital, while two percent returned
just the initial capital at the term of the investment. Loss making products returned between -0.75% and -36.8% pa., resulting in an average loss of -14.3% pa.
Some 932 capital-at-risk products matured or triggered early maturity - these products collectively produced an average annualised return of six percent over an average term of 2.17 years; whilst the 52 capital-protected products in the sample analysed delivered an average annualised return of three percent - only four capital-protected products returned just the initial investment, while over half of them have increased it with an annualised return above 2.5%.
The sample analysed also includes 61 fund-wrapped products which returned on average an annualised 3.58% for an averaged investment term of six years and two months.
The equity market boomed in 2019 with indices (to which 70% of the analysed products are linked)
delivering a gain between 16% and 26%. The year ended with the biggest gains from stocks since 2013.
The average return from the top 10 best performing products in the sample stood at 15.3% pa, compared to 13.18% pa in the same period one year prior.
Seven out of the top 10 performers were linked to single stocks (Axa, BNP Paribas, Bouygues and Casino Guichard-Perrachon, respectively) and activated the autocall trigger in less than a year.
Nonetheless some single stock products and worst-of structures incurred in losses at maturity as a result of credit events.
The period analysed ended on a low note because of the stock market crash resulting from the Covid-19 outbreak in mid-March - the few losses incurred by structured products in March 2020 resulted from the breach of active protection barriers by single stock or worst-of structures.
However, none of the index-linked products in the SRP database breached the protection barrier.
“The stock market fall meant that the maturity of many autocalls was deferred until a later date when they will potentially mature with a larger gain,” said Nikolov. “Additionally, it was not bad news for the defensive phoenix structures linked to equity indices, which still paid coupons as downside barriers were not breached.”
Underlyings & payoffs
The Eurostoxx 50 in isolation was the most prevalent underlying, accounting for 33% of all maturities - some 356 of these were linked solely to the Eurostoxx 50 and produced an average annualised return of 5.45% over an average term of 1.8 years. The upper quartile returned 6.5% per year, and the lower quartile 4.55% per year.
Nearly half (46%) of the 1,844 outstanding products with knock out dates between April 2019 and
March 2020 expired earlier. For 28%, this was the first autocall observation date while 9.6% caught up on the second observation date.
The analysis shows that early redeemed autocallables returned an average annualised coupon of 6.6% for an average investment term of 1.34 years. In addition, just over two-thirds (64%) of all autocallables recorded average annualised returns above 6%. The upper quartile returned 7.5% per year, whereas the lower quartile returned 5.3% per year.
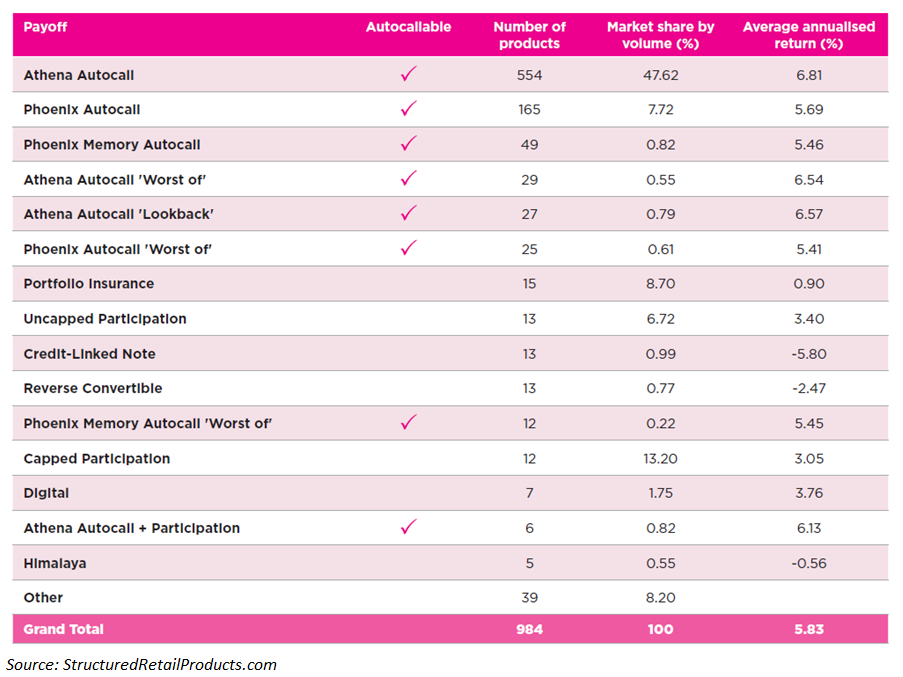
Products triggering early maturity made up 88% of all expired products in the period - they ran for an average term of 1.34 years producing an average annualised return of 6.6%.
Some 60% of the autocalls materialised on the first observation date, generally after one year of
Investment; with twenty percent occurring on their second anniversary, following a difficult year 2018 for equities.
Eight percent activated the autocall trigger on their third or their fourth call point - only 13 products in the sample reached their projected maturity.
In the meantime, over half (51%) of the index-linked products with active knock-out dates between April 2019 and March 2020 activated their autocall feature and delivered an average annualised coupon of 6.3% - of these, 321 products were linked to an index with synthetic dividend (decrement) and delivered 6.8%. The 339 products linked to market cap indices returned an annualised 5.7%.
On the flip side, 365 products linked to a decrement index and 211 products linked to a benchmark failed to knock out this time round, with more than half missing the trigger event. A third of all index-linked structures, however, will have the next exit opportunity in less than a year. This includes 104 products with quarterly observation dates; 73 products with semi-annual observations; and 31 with daily observations.
Click in the link to access the full report and the comparison between the performance of structured products versus direct equity holdings and bond strategies.
Image: Florian Wehde/ Unsplash