When hard times befall structures, there is always a smart trader that finds a way to adapt and come up with a new solution within structured products.
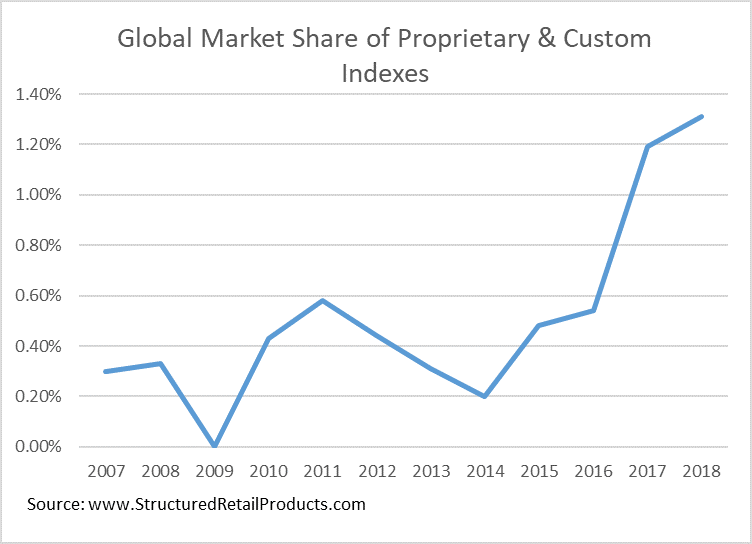
When the interest rate environment started to decline, making it difficult to offer attractive products, usage of proprietary indices started to expand, increasing 300% in 10 years, from 0.33% of total global volume sold to 1.31% in 2018 ytd.
Proprietary indices have been widely adopted as underlyings to structured products, sometimes referred as “Smart Beta”, with the aim to improve on benchmark indices. Investment banks and asset managers built their own proprietary indices for structured products based on a set of rules-based methodologies.
Why do these products look better than benchmark indices?
It’s all about volatility.
Knowing that without income for sufficient participation or coupon, the only way you could offer products would be to lower the volatility of the underlying. As such, proprietary indices, which already existed, became more interesting to investment banks.
The first step was to use multi-asset strategies, including fixed income underlyings, lowering the average volatility compared with the benchmark, while adding a rule-based methodology, with the objective to increase the Sharpe ratio.
The second step, was to control volatility, limit the proprietary index’ historical or implied volatility, making sure that the volatility would be equal to or lower than the benchmark index.
The last step, besides volatility, was to increase exposure to higher dividend stocks or underlyings as it would lower the cost of the option.
At the end of the day, there is a high and positive correlation between volatility and return, which means that as these indices have controlled or lower correlation, their return should be lower, and in return you get a higher participation rate or coupon. The added value is on the Sharpe ratio of these products, as the issuers and backtestings tell us that they give an added return per unit of volatility.
But was it worth to investors?
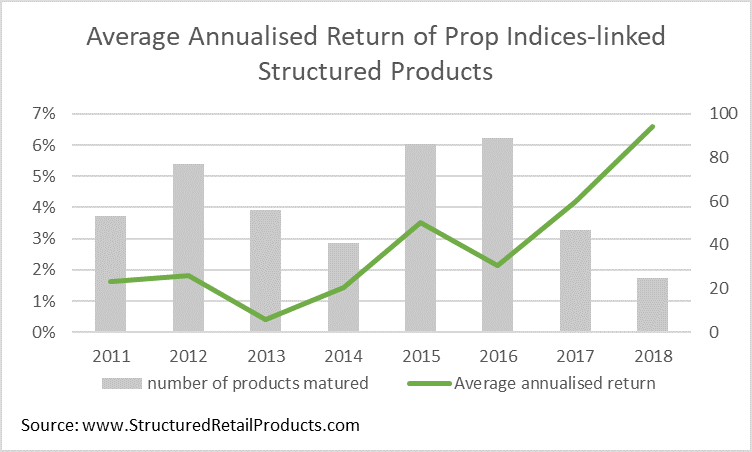
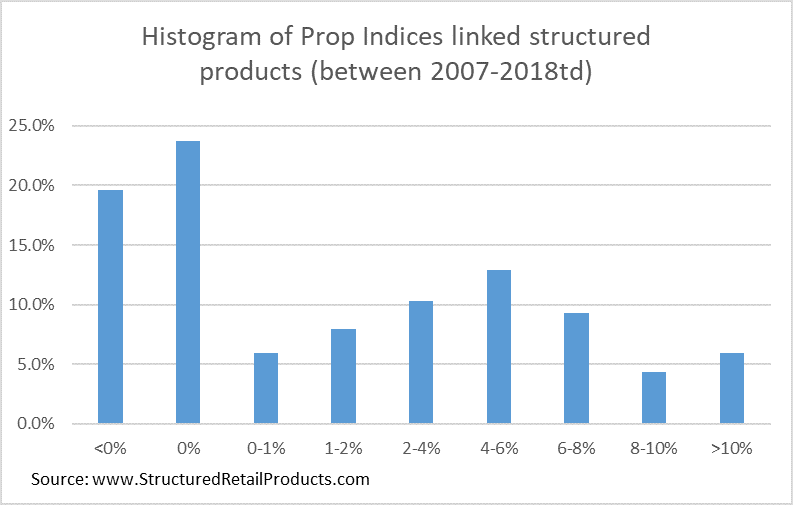
According to SRP data, on the 506 products that already matured with performance figures, the average annualised return was 3.55%, from which 20% had a negative performance and 32.5% had an annualised performance above 4%.
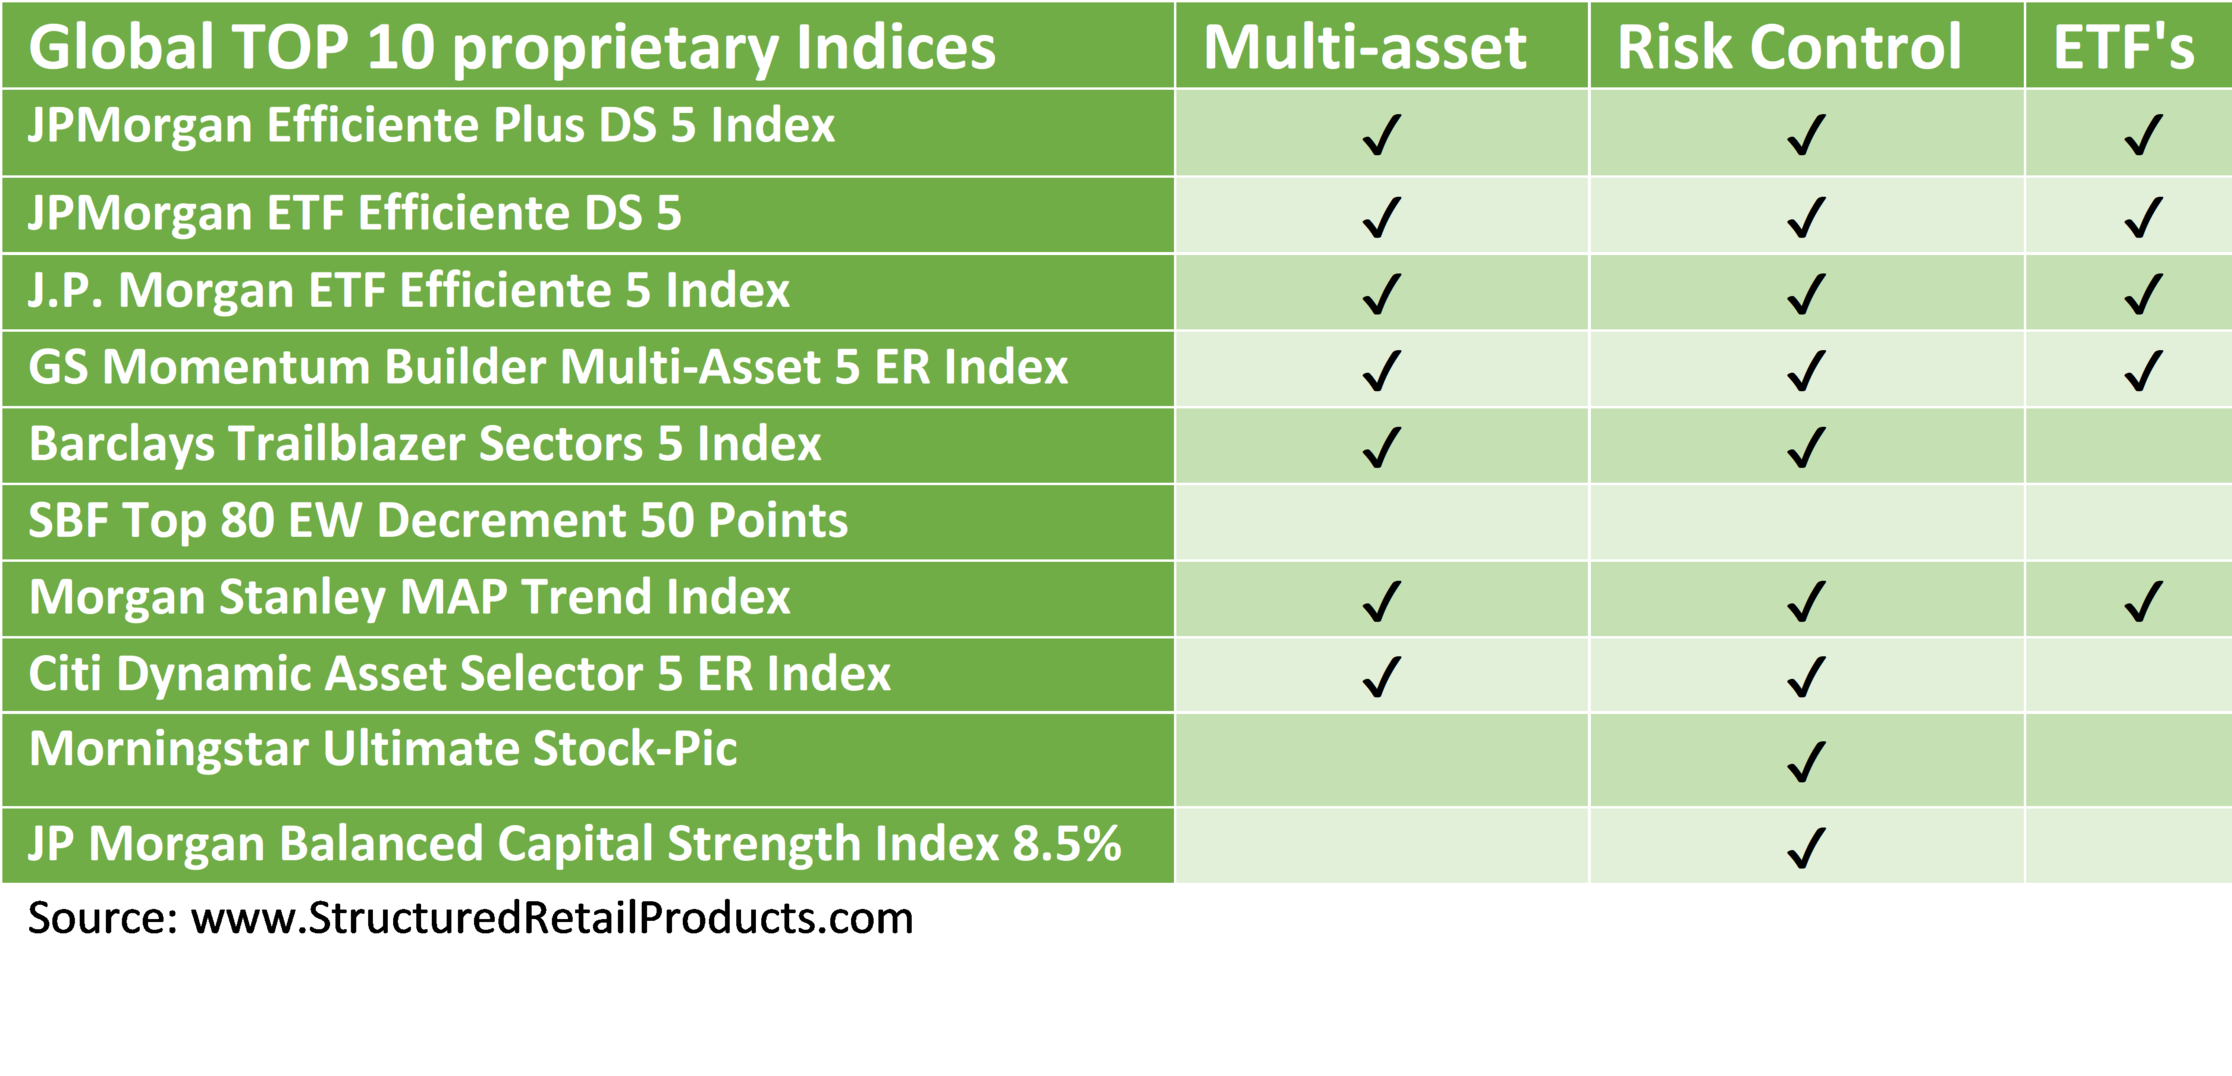
But most of this products are not based on the latest developments on prop indices. Since 2014, there are only 80 products with performances of the top 10 prop indices globally. Interestingly, during this time these products’ average annualised return increased to 5.63%, with not a single product delivering a negative return.
The motive behind this is that issuers are predominantly using these indices to protect capital, with an average of minimum capital protection of 87% on the 506 products.
Looking at these numbers, I believe it’s still early to know if prop indices are the ultimate solution to deliver return but they are definitely a good alternate to capital protected products linked to benchmarks.