
The current market turmoil and increased uncertainty are impacting how structured products are behaving, as financial engineering expert Eric Barthe explains.
The last weeks have been unique in the recent history of financial markets because of the speed of the correction - almost all markets saw widespread sell-offs (equities, corporate bonds, commodities, gold, cryptocurrencies etc).
If we restrict ourselves to the equity markets, we observed four phenomena that have direct implications on existing structured products:
- a sharp decline in equity levels;
- an increase in volatility (both realised and implied);
- an increase in correlation (both realised and implied); and
- a general lack of liquidity across all financial instruments.
All those elements have consequences on structured products.
Structured products lost value and became more volatile
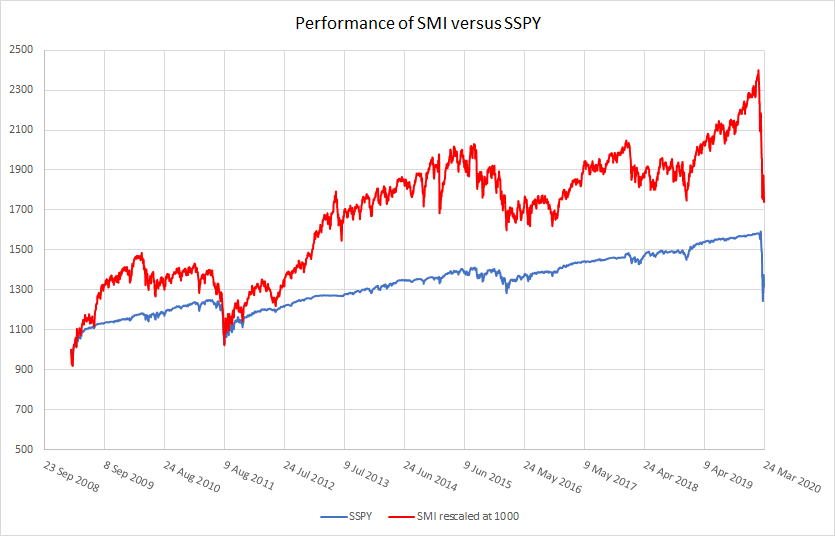
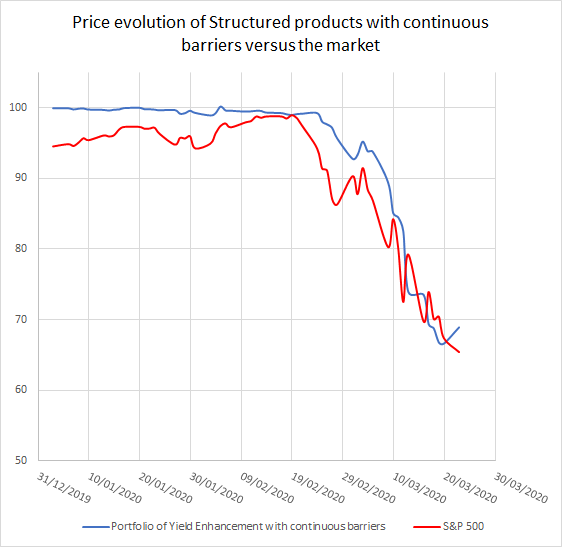
To illustrate what happened to structured products, I will use the SIX Yield Enhancement index SSPY, which is a benchmark of typical yield enhancement products listed on the Swiss SIX exchange. The SMI Index is the underlying.
I will compare that SSPY benchmark to the broad equity index SMI.
The graph below shows a steady performance of the SSPY at around five percent per annum, whatever the period is. This shows the behaviour of investors who tend to target a return (here five percent) and who probably adjust their risk via the barrier level to reach that target.
Indeed, if we exclude March 2020, implied volatility on the SMI has tended to go down since 2009, as the graph below shows. As such, keeping a five percent return means that more risks were taken.
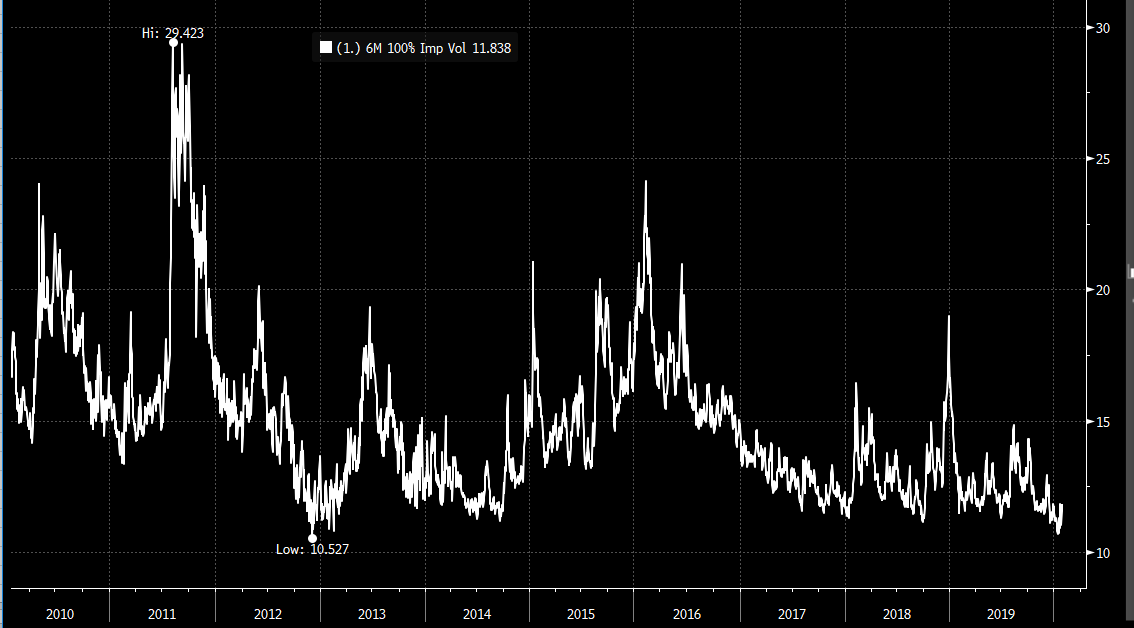
Source: Bloomberg
The SMI Index reached its high on peaked on 19 February 2020 and has lost 23.4% since then. The SSPY also reached its high on that day and has lost 13.15% since then. The smaller drop for structured products is due to the delta of yield enhancement products. We can see that the deltas of structured products was on average 13.15/23.4 = 56% along the market correction.
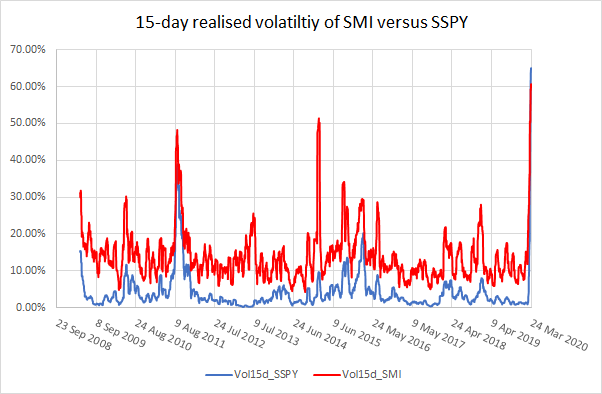
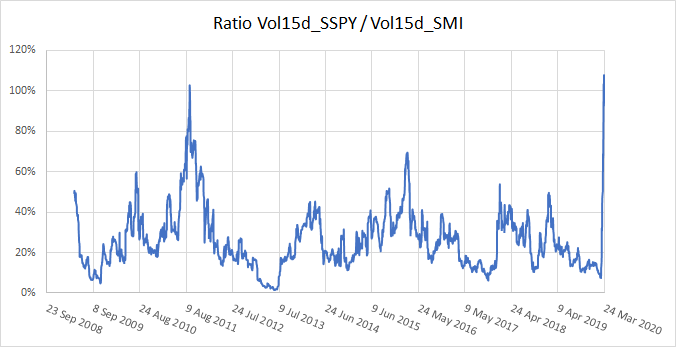
On top of the drop in value, investors were able to observe a sharp increase in the volatility of their portfolio of structured products. As the graphs below show, for most of the past 11 years, the volatility of structured products was substantially lower than the one of the market. Nevertheless, on the last move, both the equity and structured product markets reached the same realised volatility.
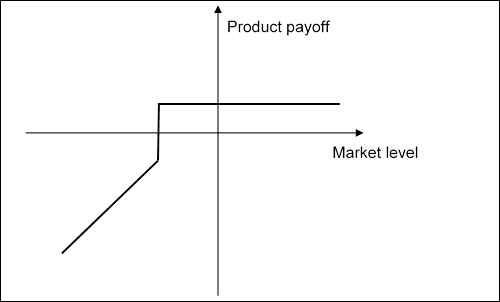
Looking at how yield enhancement products are built, none of those behaviours are surprising. Both barrier reverse convertibles and autocalls have the same major features:
- If the market is above a certain level (barrier level), they deliver the capital back and a fixed coupon.
- If the market ends below that barrier level, the coupon may still be paid but the capital itself is at risk.
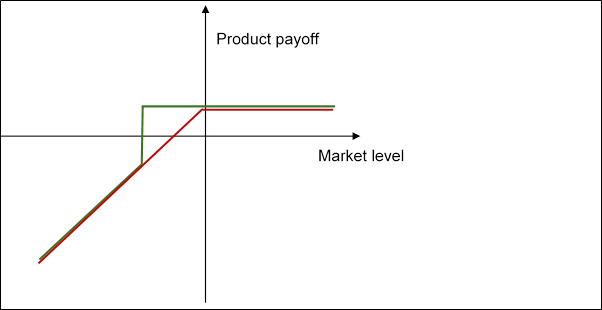
If we ignore for now the difference between European and continuous barriers, we can show the final payoff of any yield enhancement product as below.
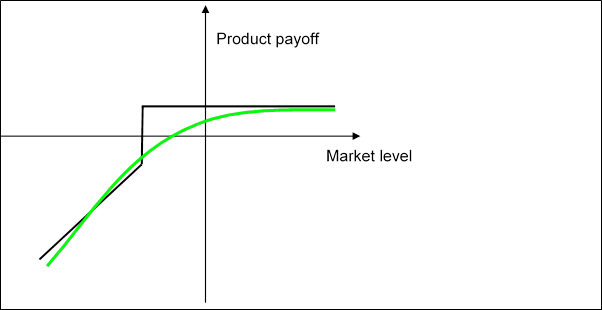
This means the mark to market of a structured product during its lifetime will look like the green curve below.
Therefore, when the market loses 20 or 30%, two things happen simultaneously. Firstly, the price of the structured product falls from A to B. Secondly, the local slope (the so-called delta, here in red) increases dramatically: not only does the price of the structured product drop but its sensitivity to further market moves increases.
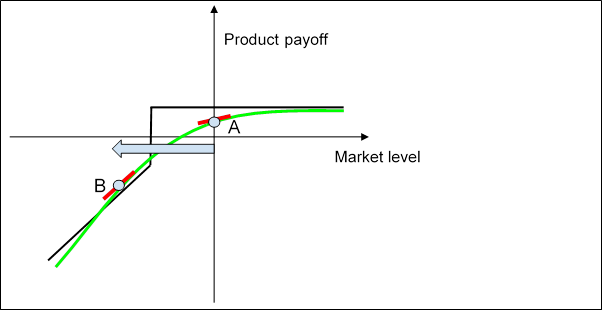
That is what has happened over the last few weeks.
Before the drop, the market was quiet and the delta was low so structured products were very quiet. Markets then dropped, structured products dropped and their delta increased. The markets became more volatile and structured products moved along with them.
Some continuous barriers were crossed
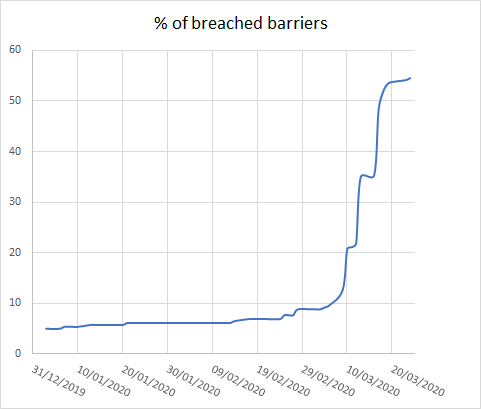
Running an analysis over a real portfolio of over 260 real yield enhancement products with underlyings diversified across geographies and with continuous barriers, we observed that as of 1 January 2020, only 4.51% of products had a barrier event. The same portfolio now has almost 55% of crossed barriers. (See graph below.)
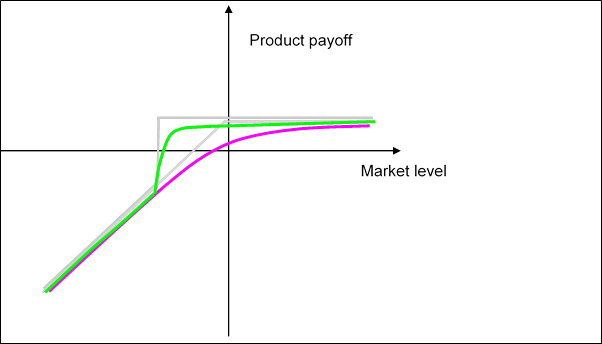
Barrier reverse convertible and autocalls with continuous (or American) barriers behave differently from the ones with final (or European) barriers. A continuous barrier, by definition, can be activated at any time. At the very time the barrier is crossed, the structured product is transformed from a capital-protected product into a non-capital-protected product.
On the graph below, before the barrier is crossed, the final payout follows the green line. Once the barrier is crossed, it becomes the red line.
The secondary market behaviour of such products, close to the barrier, is more dramatic than for a European barrier.
Indeed, as shown below, on the way down, the valuation of the product will follow the green line, with a very steep slope close to the barrier. So locally, as the market goes down, the structured product may lose more value than the market itself as the slope of the green line is greater than the purple one. Once the barrier is crossed, the green line becomes the purple one.
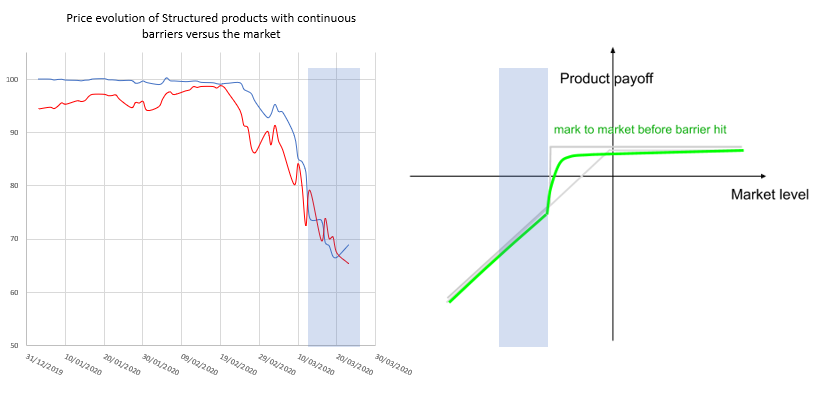
The acceleration of the green line when the market is down is exactly what we observed. Here again we take our portfolio of 260 well-diversified structured products with continuous barriers (in blue), and plot their valuation versus the S&P 500 (in red). (See graph below.)
We can observe four zones.
Zone 1
For the first months of 2020, the portfolio was very stable, despite the markets moving. This was the case until 19 February 2020.
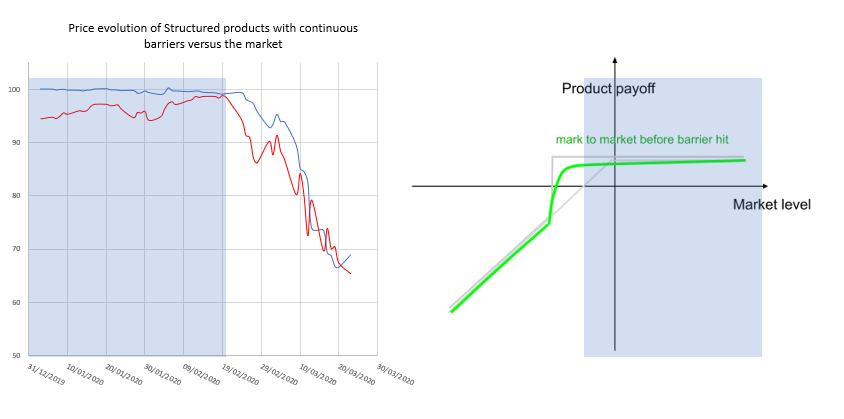
Zone 2
The market dropped by more than 10% but the portfolio is still stable.
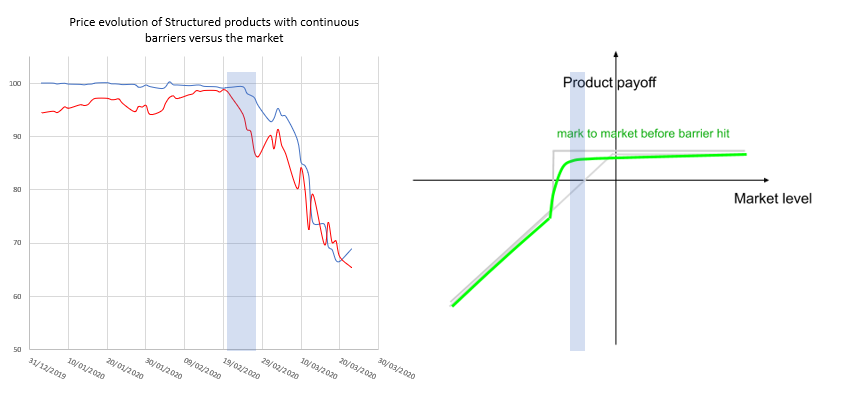
Zone 3
The market keeps dropping and the valuation of the portfolio decreases faster than the market. The slope of the green curve is much higher than 1.
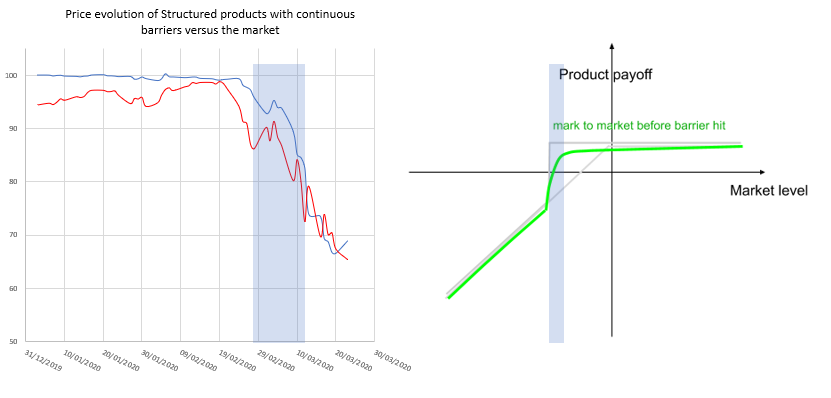
Zone 4
The market keeps dropping and the valuation of the portfolio moves exactly in line with the market. The slope of the green curve is 1.
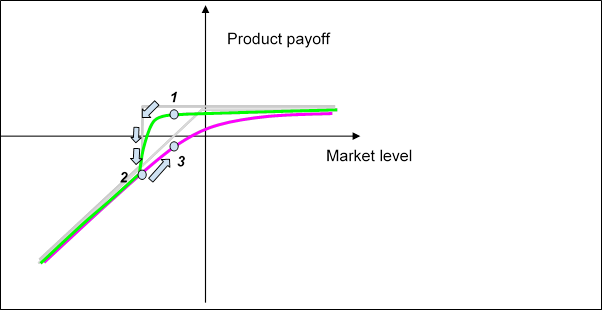
Now we are in the so-called zone 4, below barrier levels and the implications are important: even if the market bounces back, structured product will not reach the same levels as before. The product may initially quote at 1, then 2 when the barrier is crossed. If the market bounces back, then the product may quote at 3, so substantially lower than 1.
The probability of autocalling early has decreased
As the market went down, the likelihood of products autocalling early has decreased substantially, so the expected duration of autocallable structures has increased. As a consequence, they became more sensitive to interest levels. A drop in interest rates is positive for structured products but a potential increase in issuers’ credit spread may hurt in the secondary market.
In that respect, step down autocall structures resisted much better.
A lack of liquidity also affected structured products
When investors unwind structured products, the issuer also needs to unwind the derivatives hedges that were necessary to hedge the trade initially. As derivatives markets became particularly illiquid last week, the cost of unwinding the hedges has increased, which has a direct impact on the unwind prices of the structured product, which could be lower than expected.
About Eric Barthe
Eric is currently head of structuring at Anova Partners, based in Zurich, where he drives the firm’s financial engineering efforts.
He started his career as an exotic trader at Goldman Sachs in London. He was there for 8 years, trading on the index and single stocks exotic book. After a short interval with the Boston Consulting Group, Eric joined Leonteq as global head of structuring and head of financial engineering.
He was also previously a professor of financial engineering for the MSc International Finance at HEC Paris.
He is a graduate of the Ecole Centrale Paris, HEC and the London School of Economics.