Sharp declines in value across asset classes triggered by the Covid-19-related turmoil have had an impact on structured products. As financial engineering expert Eric Barthe discusses, widespread sell-offs in most markets, spikes in volatility and the very real prospect of losses faced by product issuers have all contributed to the ongoing turbulence.
In particular, the global market crash in March saw issuers of a huge number of autocalls linked to the main market cap indices such as the Eurostoxx 50 face spiraling hedging cost and potential losses.
Companies have been suspending or scrapping dividends as they rush to keep hold of cash reserves amid the ongoing pandemic. According to S&P Dow Jones Indices, companies have been withholding some $23 billion worth of dividends so far. This has had an impact on structured products hedging desks that were expecting to received those dividends as part of their hedging strategies.
Why does hedging exist and how does it work?
Most structured products in the market are autocallables (in Europe) or fixed coupon notes (in Asia). Since the final payoff and the potential early redemption of those products depend on the performance of the underlying securities at different points in time, those payoffs cannot be replicated and hedged statically by traders.
On the contrary, traders constantly need to readjust their hedge depending on the performance of the underlying security. That dynamic hedging activity applies to the underlying security itself (traders will buy/sell the underlying security), volatility (via vanilla options), interest rates (via interest rates swaps) and dividends (via forward contracts or dividend swaps).
At inception, the trader will be short delta, long volatility and long dividends: the more dividends the underlying security is expected to pay, the more profit the trader will generate on their hedge.
They will hedge those risks out (by buying the underlying security, selling options, and selling dividend swaps or forwards).
If the market drops, the delta [a measure of how the price of an option reacts to a shift in the price of the underlying asset] of autocallables increase, so the trader will have to buy more underlyings securities and their exposure to future dividends will increase. As such, they will need to hedge out by, for instance, selling dividend swaps. It is key for the trader to be able to estimate where the level of those dividends will be when the market is lower.
How is that estimation carried out?
It is all about modelling! Let us first remind ourselves of some basics on how companies determine dividends and how it affects their modelling.
At the beginning of year N, company directors usually suggest a dividend based on the financial results achieved by the company in year N-1. That dividend is then agreed upon in a later annual general meeting. For that reason, early in year N, the value of the dividends the company will pay in year N is pretty much established.
As the year N passes, the company will announce its intermediary earnings for year N, so any uncertainty on dividends that will be paid in N+1 progressively disappears. It is worth noting that to attract investors, companies tend to keep their dividends as stable as possible. Looking forward to dividends to be paid in, for example, in year N+10, the uncertainty is much higher and fully dependent of the future company’s financial performance, itself reflected in the stock price.
So common practice is to model (and expect) short dated dividends as being constant, irrespective of the spot level, and to make longer term dividends fully proportional to the equity level. Some more advanced models also allow the dividends to have their own randomness.
So what went wrong in recent weeks?
The short answer is that dividends did not move as most models would have suggested.
The market started to correct at the end of February 2020, after most dividends were announced (but not voted), which allowed the short dated dividends to move in a way that rarely happened before.
If we look at 2008 (see graph below), dividends moved more or less as expected. As the correction on Eurostoxx 50 really happened in late summer (see the white line bellow), the 2008 dividends (in blue) were not affected. The 2009 ones (in orange) moved in line with the market until the beginning of 2009 when they stabilised.
The longer dated dividends (yellow and purple) moved more than proportionally to the market, and that probably caused some losses.
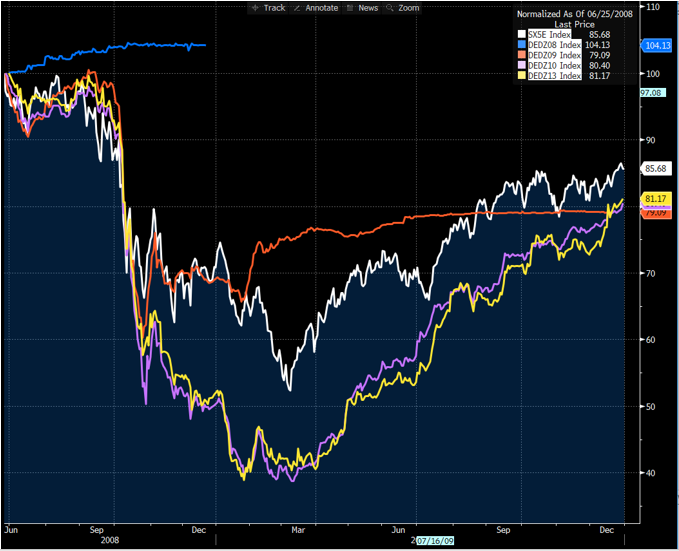
Source: Bloomberg
In 2011 (refer to graph below), the year of the Greek crisis, everything happened according to the theory. The correction happened in the summer of that year. The 2011 dividend (blue) did not move. The 2012 figure (orange) took a hit but much less than the others as some partial results for 2011 were already released. It finally stabilised in early 2012. The longer dated 2016 dividend (yellow) moved fully proportionally. The one in the middle, in 2013 (purple), started by being fully proportional then behaved in both a fixed and proportional way.
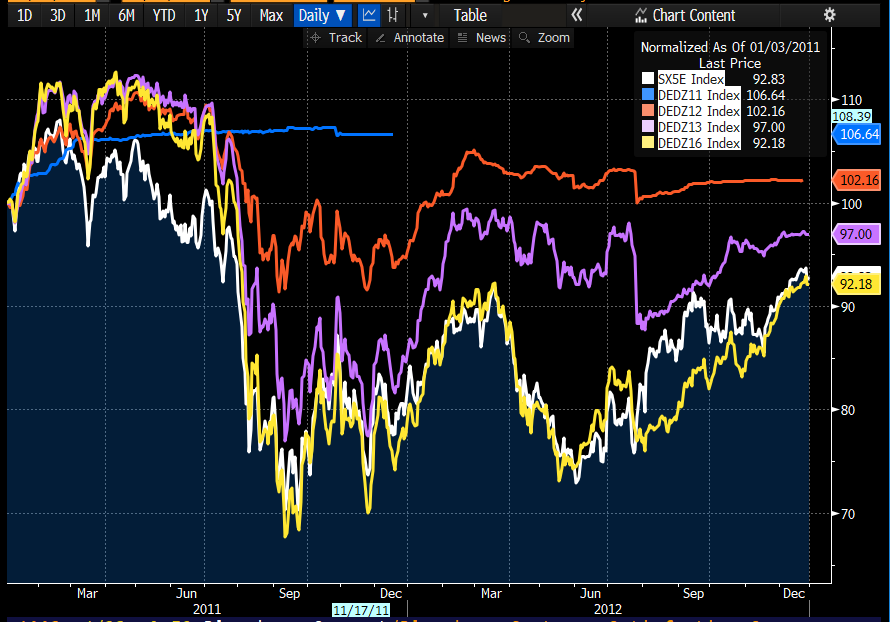
Source: Bloomberg
For 2020, the picture is very different, as the graph below shows.
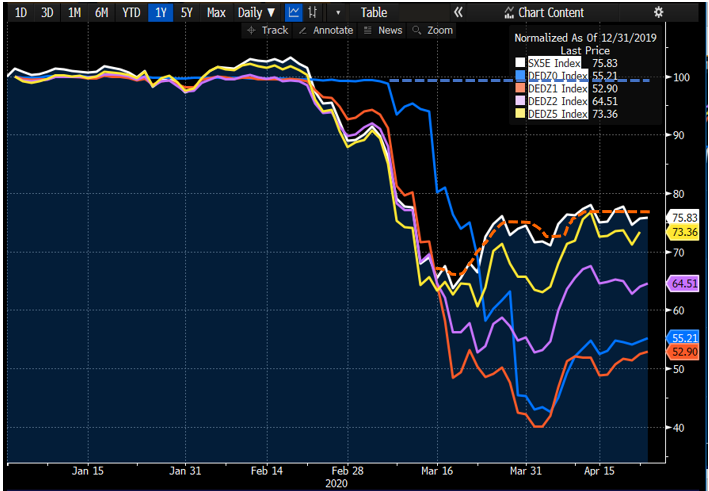
Source: Bloomberg
The correction happened in late February (so after the announcements but before the votes). Even with the results for 2019 fully disclosed, the calendar and political pressure allowed for the 2020 dividend not to behave in a fixed way at all. Companies started to say they would not be paying out dividends, in contrast to what they had previously suggested! As a result, 2020 dividends (blue) corrected more than proportionally instead of staying fixed, and 2021 dividends (orange) corrected more than proportionally.
The 2022 and 2025 dividends moved more or less as expected.
A traditional model would have predicted the moves below (in dotted line) for 2020 and 2021 dividends (see below):

Source: Bloomberg
As a result, the real 2020 dividends are trading at 55% of what models were predicting. The 2021 dividends are also lower (at 70% of previously predicted levels).
That is what has caused the losses: as the market dropped quickly (white line), traders’ dividend exposure increased and they had to sell dividend swaps. That is expected and not a problem as long as the dividends move in line with the model. But in the current scenario, they could sell only at 55% (2020) and 70% (2021) of what they expected, hence the losses.
Do you think models will change due that move?
It’s worth remembering that models are tools for traders to anticipate their risks, and that traders can always hedge outside the model. A model is just an instrument that a trader should use only if they is conscious of their limitations.
Nevertheless it would not be surprising that the assumption that short dated dividends are fixed could be revisited, or at least that dividends will be deemed certain and fixed only after they have been voted upon.
Photocredit: Austin Distel Unsplash