
Powered by CAPE®, the Shiller Barclays CAPE® Global Sector Index identifies long-term value potential across diversified global sectors.

What is Value investing?
Value investors identify businesses that may no longer be supported or approved of, or are simply underestimated, but where they believe the business is sound and capable of producing strong economic returns. Investors seek out companies, in their opinion, whose share prices do not reflect the true worth of the company and are consequently trading at a discount to either the market index or their sector peers.
There are several reasons why a stock may become undervalued or suffer a downturn in its share price, the most common being short term profit disappointment, or a company may be undergoing major changes such as a restructure which often results in a share price fall, also a company can be in an industry or sector which is simply out of favour.
Value investors are seeking what is known as a ‘margin of safety’, or in other words, a gap between the current share price and its true value over time, and look to invest in stocks that are trading at a discount to their intrinsic value in the expectation that over a period of time, the stock price will increase to reflect its true value.
Value investors need to exhibit caution to avoid ‘value traps’; firms in terminal decline, unable to implement positive change or complete a turnaround.1
After significant research between Barclays and Professor Shiller strong evidence was found that a value investing approach could also be applied at a sector level, whereby buying undervalued sectors could also produce excess returns.
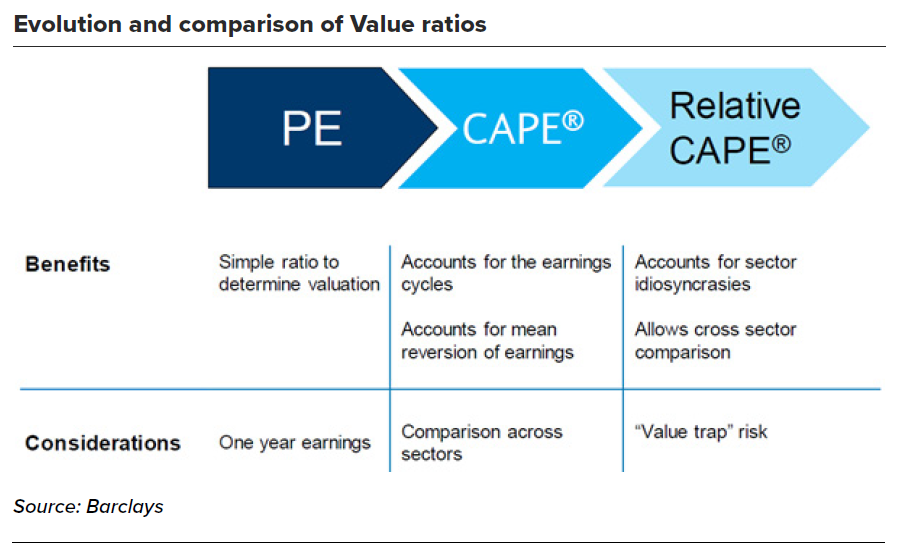
The evolution and comparison of Value ratios
The CAPE® ratio was introduced in 1988 by Professor Shiller and John Y. Campbell as an improvement to the classic Price/Earnings (P/E) ratio.
The traditional P/E ratio is equal to price divided by the most recent 1-year earnings. A company’s earnings can be volatile from year to year during the ups and downs in each business cycle. The traditional P/E ratio can, at times, be potentially unreliable in terms of understanding a companies’ “true” valuation given a single year of earnings may not reflect the companies’ actual earning power.
The CAPE® ratio is a variation on the traditional P/E ratio that uses the ten-year average of inflation-adjusted earnings instead of a single year of earnings. The CAPE® ratio may be suited for detecting long-term over-valuation and under-valuation in the stock market, since the ten-year horizon is longer than most business cycles, and therefore taking a long term average aims to smooth out the short term noise.
Each Index in the Barclays Shiller Index Family uses a modified version of the classic CAPE® ratio, called the relative CAPE® ratio, to standardise comparison across sectors. On an unadjusted basis some sectors always appear overvalued while others always seem undervalued, due to idiosyncratic differences between sectors. These persistent biases in sector CAPE® ratios are driven by inherent long-term underlying differences between sectors, such as the level of industry maturity, growth prospect and regulations. By using the Relative CAPE® ratio to select sectors, the Index aims to pick sectors that are potentially undervalued versus their own history.
The relative CAPE® indicator is the ratio of the current CAPE® ratio for a sector to its historical rolling twenty-year average CAPE® ratio with the additional removal of some outliers, in order to mitigate the effects of extreme or unusual events in the history of the applicable sector.
The Shiller Barclays CAPE® Global Sector Index
As Value investing sees a resurgence, Professor Shiller and Barclays have extended their successful range of sector rotation indices to Global sectors. Using the latest thinking from Professor Shiller and Barclays, based on decades of Professor Shiller’s research, the Shiller Barclays CAPE® Global Sector Index is designed to offer global equity market exposure with a value bias, and is intended for buy-and-hold investors with a multi-year time horizon.
A diversified global index
Starting with a universe of ten sectors, the global index systematically identifies and allocates to undervalued global sectors with the most positive price momentum
Innovative methodology
The Index aims to outperform by applying Relative CAPE® to identify undervalued sectors set for outperformance. The index additionally combines Value with Momentum to avoid sectors that might be ‘value traps’.
Backed by economic expertise
50 years of historic price and earnings data have been re-created for the global sectors. The continued partnership between Professor Robert Shiller and Barclays incorporates the expertise and latest thinking on the application of Value and CAPE®.
The partnership
Professor Robert Shiller is an American economist, best-selling author and Sterling Professor of Economics, Professor of Finance, and Fellow at the International Center for Finance at Yale University.
Since 1991 he has, together with Richard Thaler, directed the Behavioral Finance Workshop at the National Bureau of Economic Research. Professor Shiller is ranked among the 100 most influential economists in the world. In 2010, he was named a top global thinker by Foreign Policy magazine, and in 2011, he was listed by Bloomberg as one of the 50 most influential people in global finance.
He was jointly responsible for developing the Standard & Poor’s/Case-Shiller Home Price Indices for the most important metropolitan regions in the US. The indices are widely used in academic research, investment management and are considered benchmarks for housing sentiment. Professor Shiller writes a column for the New York Times. He writes a regular column 'Finance in the 21st Century' for Project Syndicate, which publishes around the world. He is also a frequent guest on Bloomberg and CNBC.
In 2012, Professor Robert Shiller partnered with Barclays to develop the first Shiller Barclays CAPE® Index Family, based on US Sectors. Since then, Barclays and Professor Robert Shiller have extended the range of indices to include Europe and Japan sector strategies and then launched REIT, single stock and multi asset indices. In September 2022 Barclays and Professor Shiller added the Global Sector indices, applying a similar methodology to the US and European Sector indices, but this time providing exposure to global developed market stocks.
Find out more about the Shiller Barclays CAPE Global Sector Index
For informational purposes only. It is not intended for distribution to retail investors.
1indices.barclays/shillerglobalsector
An investment in the Index may also involves fees and costs as well as a range of risks. The following is a summary of these fees and costs and certain risks associated with the Index. You should consider the following, and consult with your advisers and read any product documentation carefully, before investing in any financial product based on the performance of the Index.
The Index methodology may be ineffective in allocating exposure to the best performing sectors.
There can be no assurance that sectors with lower Relative CAPE® ratios and higher 12-month price momentum will outperform sectors with higher Relative CAPE® ratios and/or lower 12-month price momentum.
Because the Index portfolio will allocate to a selection of chosen sectors, with a max weight of 25% per sector, the predefined weightings among the sectors may not be the most optimal allocations even if the Index is successful in selecting the best performing sectors.
Because an Index will at any time only be invested in a limited number of sectors, it may produce lower returns than an investment in a more diversified pool of assets.
Certain versions in the Index family may include deductions for fees and costs.
These deductions will reduce Index performance, and the Index will underperform similar portfolios from which these fees and costs are not deducted.
THE SHILLER BARCLAYS INDICES HAVE BEEN DEVELOPED IN PART BY RSBB-I, LLC, THE RESEARCH PRINCIPAL OF WHICH IS ROBERT J. SHILLER. RSBB-I, LLC IS NOT AN INVESTMENT ADVISOR, AND DOES NOT GUARANTEE THE ACCURACY OR COMPLETENESS OF THE SHILLER BARCLAYS INDICES OR ANY DATA OR METHODOLOGY EITHER INCLUDED THEREIN OR UPON WHICH IT IS BASED. NEITHER RSBB-I, LLC NOR ROBERT J. SHILLER OR ANY OF THEIR RESPECTIVE PARTNERS, EMPLOYEES, SUBCONTRACTORS, AGENTS, SUPPLIERS AND VENDORS (COLLECTIVELY, THE “PROTECTED PARTIES”), SHALL HAVE ANY LIABILITY, WHETHER CAUSED BY THE NEGLIGENCE OF A PROTECTED PARTY OR OTHERWISE, FOR ANY ERRORS, OMISSIONS, OR INTERRUPTIONS THEREIN, AND MAKE NO WARRANTIES, EXPRESS OR IMPLIED, AS TO PERFORMANCE OR RESULTS EXPERIENCED BY ANY PARTY FROM THE USE OF ANY INFORMATION INCLUDED THEREIN OR UPON WHICH IT IS BASED, AND EXPRESSLY DISCLAIM ALL WARRANTIES OF MERCHANTABILITY OR FITNESS FOR A PARTICULAR PURPOSE WITH RESPECT THERETO, AND SHALL NOT BE LIABLE FOR ANY CLAIMS OR LOSSES OF ANY NATURE IN CONNECTION WITH THE USE OF SUCH INFORMATION, INCLUDING BUT NOT LIMITED TO, LOST PROFITS OR PUNITIVE OR CONSEQUENTIAL DAMAGES, EVEN IF RSBB-I, LLC, ROBERT J. SHILLER OR ANY PROTECTED PARTY IS ADVISED OF THE POSSIBILITY OF SAME.