We look at trends in issuance, maturities and returns across index-linked products in the US market.
Structured products linked to equity indices make up the highest proportion of products on StructrPro.
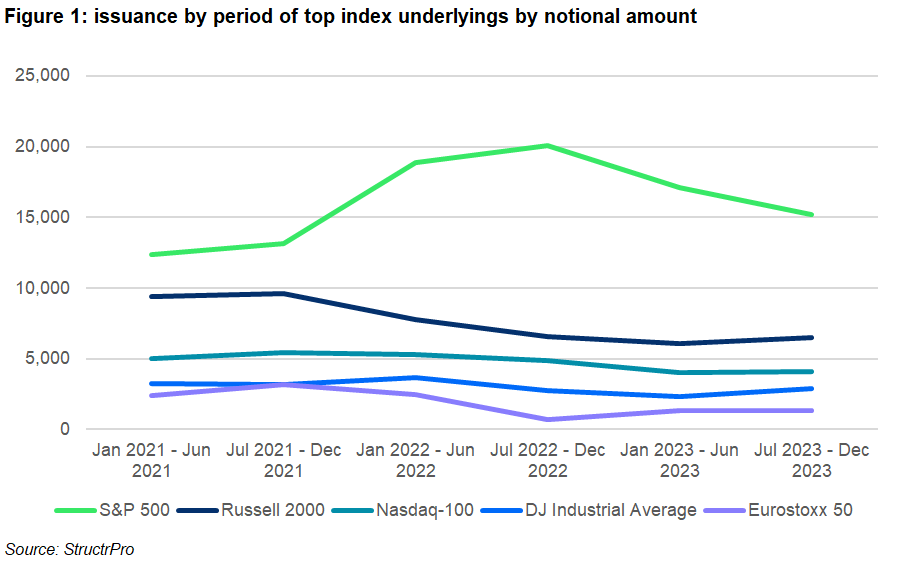
Four out of the top five indices in the league table are US indices with the only exception the Eurostoxx 50 index. The S&P 500 index was present in 49% of all products over the period either as the sole underlying or as part of a basket (or worst-of set).
For the past two years the proportion of S&P 500 linked products has been consistently higher than 50% with the peak coming in the second half of 2022 where 65% of products included this top index.
Looking back, the percentage of products striking after 1 January 2021 linked to each underlying exclusively compared with the percentage of products where the underlying is one of multiple basket components gives an interesting insight into the use of these indices as structured product underlyings.
The S&P 500 and Eurostoxx 50 have a similar split between single underlying products and basket products. These indices are used as the main benchmark underlying for their respective regions and 27% of all single underlying products are linked to one of these two underlying assets.
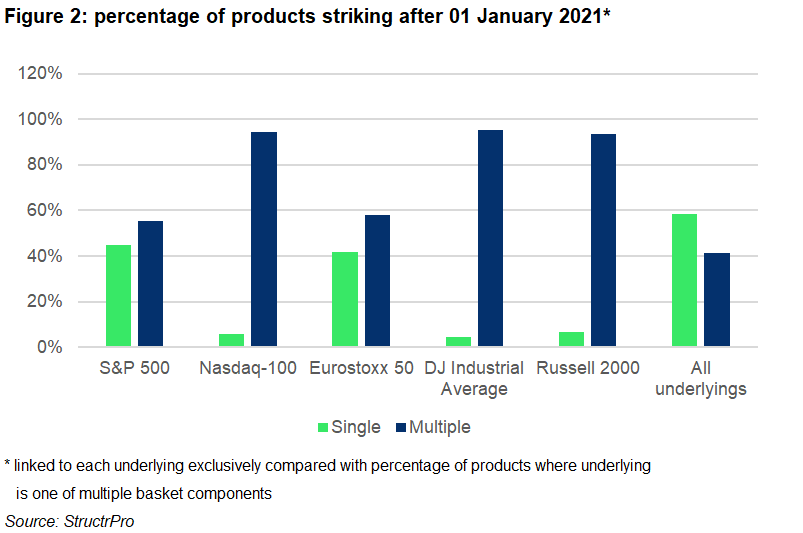
The remaining three US indices are much more frequently used as part of a basket than solely. Whether based on investor demand or issuer choice for the most part if a product is linked to a single US index it will be the S&P 500 index. The other US indices are used to increase diversification or risk by way of worst-of payoff structures.
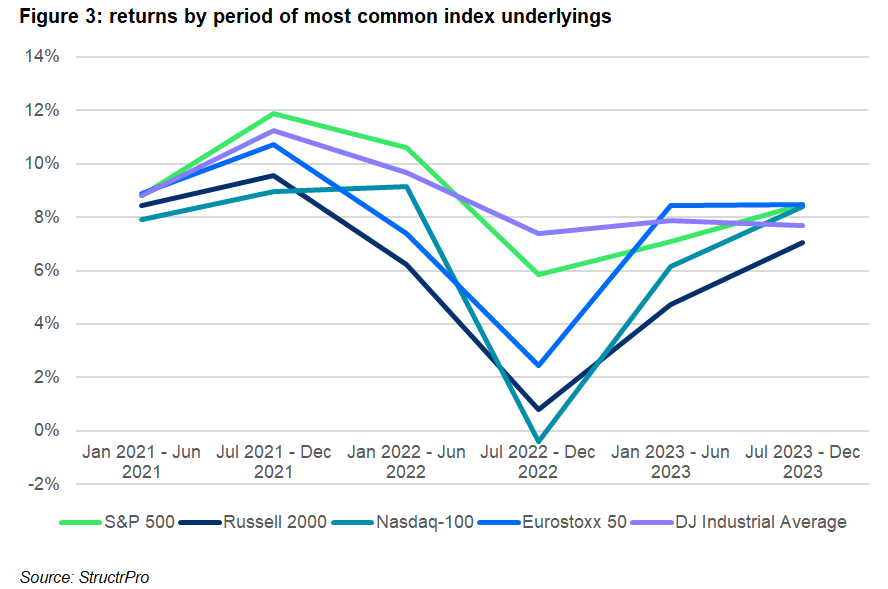
The returns by underlying for each period shown in figure 3 illustrates that whilst the overall pattern of returns is similar with all five having the same worst period in common, there are quite significant differences in actual returns over the past three years.
The only negative figure during this period was for the Nasdaq 100 index which had an average return of just below zero of -0.42% for the second half of 2022. The highest average returns observed were for products linked to the S&P 500 in the first three periods (Jan 2021 – Jul 2022).
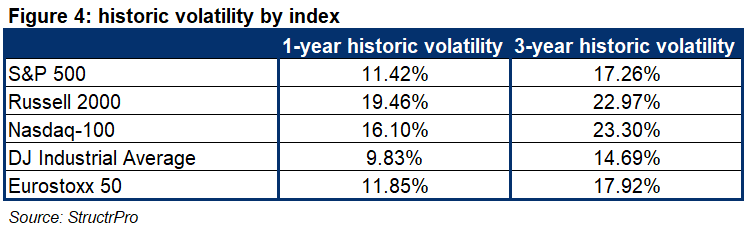
The Dow Jones Industrial Average Index has the lowest historic volatility of the five indices which seems to be reflected in the product returns as they are the most stable across the period. The Eurostoxx 50, Russell 2000 and Nasdaq-100 have larger variations in returns over the six periods which is likely to be a combination of respective underlying performance and product payoffs.
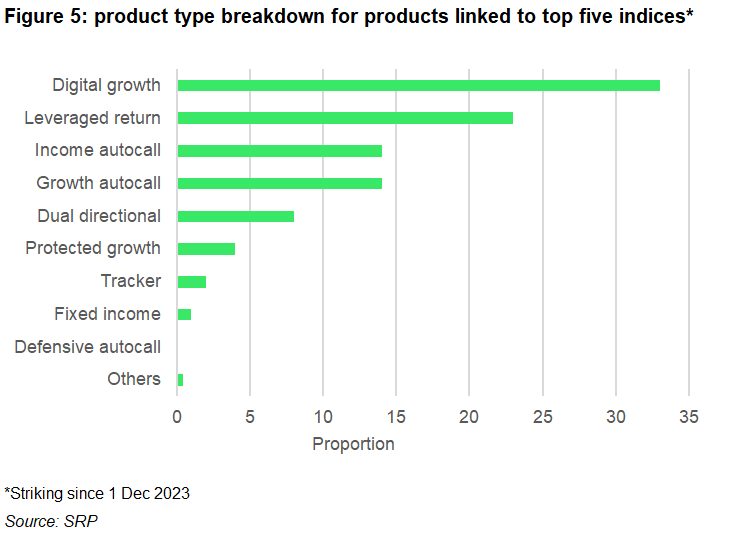
The largest product type for index linked products is the digital growth. This is a simple product type that pays a fixed defined return at maturity if the final underlying level is greater than the contingent level.
This product type is followed by two more growth products: leveraged return and growth autocall.
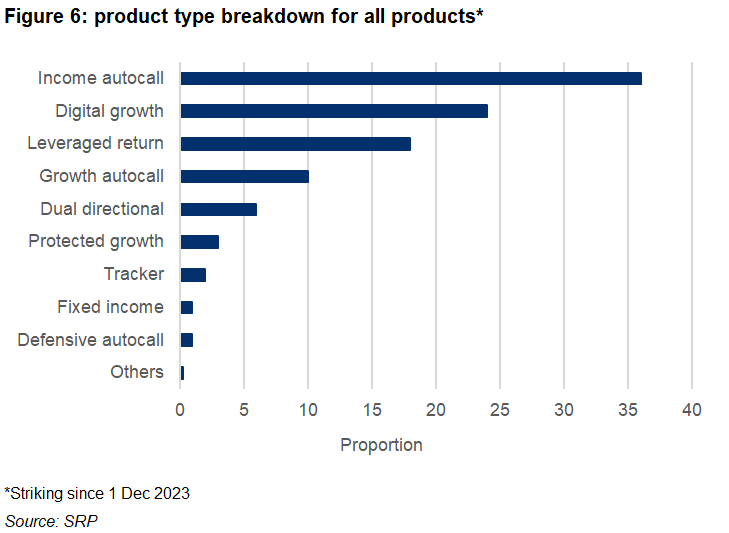
Across all US products the most common product type is income autocall which accounts for over a third of all products which must make it a more popular choice for stock or ETF linked products.
For both index linked products and all products leveraged return is the product type with the highest average return. Due to the nature of these structures they can pay very high returns under favourable conditions when the underlying value increases.
Structured product linked to equity indices are a core part of the market. Although the product types and levels of issuance fluctuate due to trends and conditions, we expect that they will continue to dominate in terms of popularity and market share.
StructrPro is a tool that can be used to analyse a single product or portfolio of products from the US structured product market. This analysis includes both live and matured products from the SRP database using analytics powered by FVC. It includes a universe of over 80,000 CUSIPs.
Image: Pixels Hunter/Adobe Stock