Exchange-traded funds (ETFs) are one of the top five asset classes for the US structured product market by product sales this year.
Ahead of ETFs as underlyings are various types of equities including indices, shares and index baskets plus interest rates. The total market share linked to ETFs for the year to date is 5.51%, slightly down on the figure for 2023 of 6.83%, according to SRP data.
Using StructrPro to examine underlying trends in the US market based on SRP data, we can observe that the most popular and widely used ETFs typically aim to track the performance of a benchmark index, usually also used directly as product underlyings.
This is the case for the top three ETFs over the past three years on StructrPro as shown below.
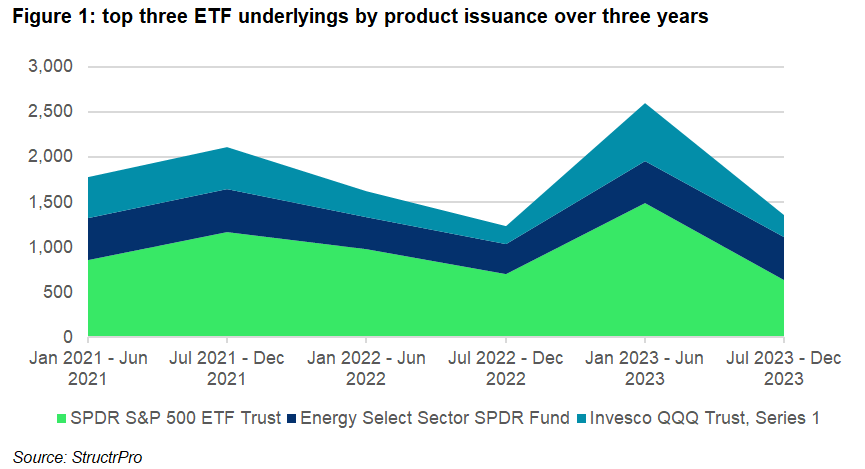
The SPDR S&P 500 ETF Trust and Invesco QQQ Trust, Series 1 aim to track the S&P 500 index and Nasdaq-100 Index respectively.
The second largest ETF, the Energy Select Sector SPDR Fund is slightly different as there are more products linked to the ETF than the index it tracks. This will be due to differences in option liquidity and hedging cost which make the ETF more attractive.
The chart above shows how products linked to the most popular of the ETFs follow similar trends across the past three years and although the total notional varies the share of the market stays similar.
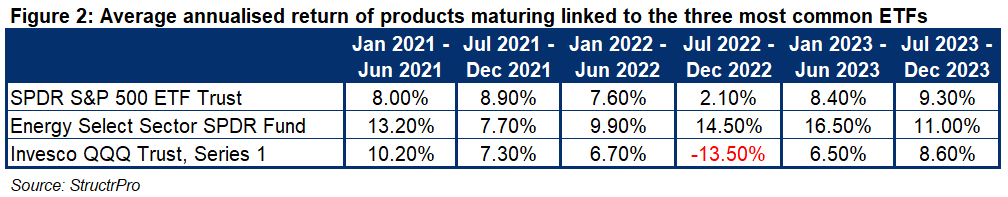
Over the past three years product linked to the Energy Select Sector SPDR Fund have some of the highest returns of ETF linked products. Overall, there were 23 ETFs in the top 100 underlyings by notional amount and of these the highest average product return for any six-month period was 16.5% for products linked to the Energy Select Sector SPDR Fund maturing in Jan 2023 - Jun 2023.
The underlying itself has been on an upward trend since lows in March and October 2020
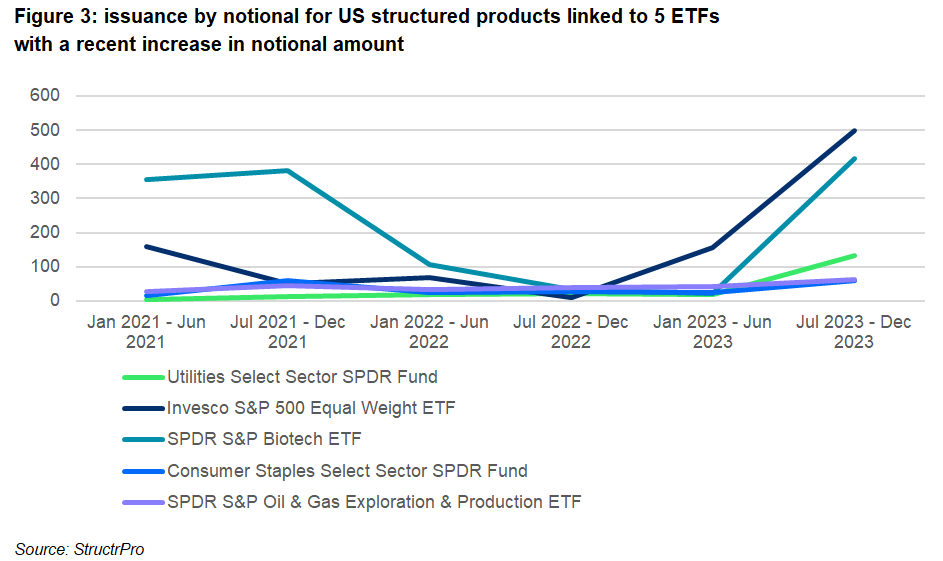
Figure 3 shows a chart of issuance by time period of a selection of ETFs taken from the StructrPro database. These ETFs are all in the top 100 underlyings on StructrPro and had a large notional in the final period as a proportion of total notional over the whole three years. The rationale for looking at this sample is to see if there are any trends that can be identified.
The ETFs shown in Figure 3 cover a range of industries: utilities, biotechnology, oil and gas and consumer staples.
The final ETF is an equal weight version of the S&P index. The largest percentage increase in notional can be seen in the Utilities Select Sector SPDR Fund which had an issuance of over six times the previous period in July 2023 – December 2023. Most products linked to this underlying are income autocall products and over 95% of them are multi-asset products.
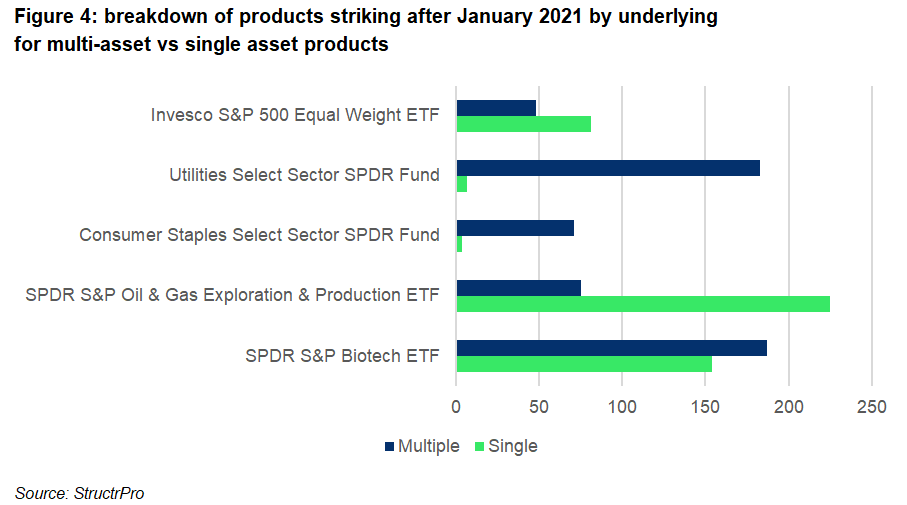
Figure 4 gives an insight into whether these underlyings are used as part of a worst of structure or individually.
A worst-of structured product may have a broad set of underlyings exposing the investor to multiple sectors or assets. Low correlation between the chosen assets will allow for higher headline returns so may appeal to both issuers and investors.
The chart shows the SPDR Oil & Gas Exploration & Production ETF was the most popular of the selection to be used as a single underlying.
For the investor the advantage a product linked to an ETF will depend on whether the product on offer is more appealing due to the structure or terms.
ETFs are widely used as a cheap and easy way to gain access to desirable sectors or trends and remain popular structured product underlying assets for the same reasons.
Image: Maksym Yemelyanov/Adobe Stock