Worst of baskets, single shares and market cap indices dominated the US market in 9M2021.
Some 23,491 structured products worth US$76.2 billion had strike dates in the US during the first nine months of 2021 – an increase of 22% by issuance and up 32% by sales volumes compared to the same period in 2020, according to SRP data.
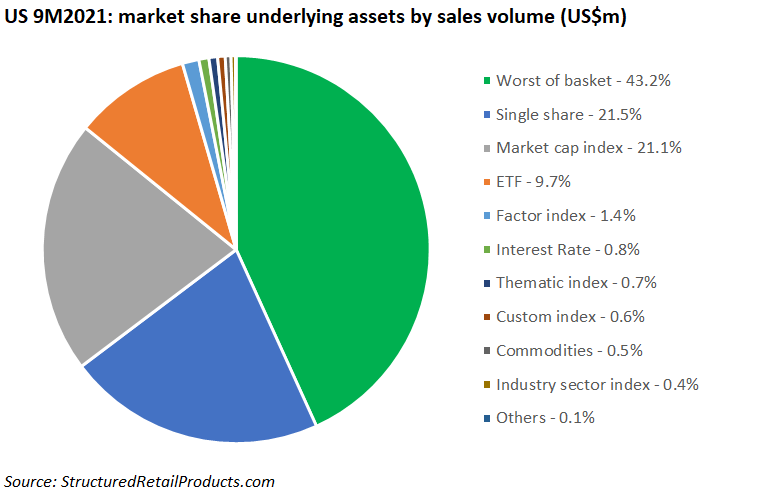
Worst of baskets collected US$32.9 billion from 10,068 products in the period, which translated in a market share of 43.2% – twice as big as that of the number two asset (single stocks – 21.5%).
Structures linked to single stocks accumulated sales of US$16.4 billion from 7,316 products with the shares of Apple (US$1.4 billion from 391 products), Tesla (US$1.1 billion from 412 products) and Amazon (US$757.7m from 277 products) the preferred options for the US investor. In total, 415 different stocks were seen in the period.
Market cap indices achieved sales of US$16.1 billion from 2,829 products – an average of US$5.7m per product – while the 1,951 products linked to exchange-traded funds (ETF) also experienced significant sales (US$7.4 billion). Of these, the ARK Innovation ETF was the most popular by issuance (320 products). The highest sales were accumulated by products linked to SPDR S&P 500 ETF Trust (US$1.8 billion).
The most used underlying in 9M 2021 was the S&P 500, which appeared in 7,091 products (US$28.3 billion) – either as a single index or as part of a basket – followed by Russell 2000 (US$23.6 billion/6,912 products), and Nasdaq 100 (US$13.8 billion/4,681 products).
Finally, the best-selling product of the period, Bank of America’s Accelerated Return Note S&P 500, sold US$137m at inception. The 1.2-year registered note, which was issued via Barclays, offers 300% participation in the rise of the index, capped at 10.72%
Check out the below pie-chart for the preferred underlying assets of the US investor.