
As the number of custom and proprietary underlyings increases, we look at the performance of two of the most popular underlying indices in the US market developed by investment banks.
The US structured products market has thousands of products linked to benchmark indices and individual stocks.
Proprietary indices are an important alternative and two of the most popular choices are momentum strategy indices - the JPMorgan ETF Efficiente 5 Index and the Goldman Sachs Momentum Builder Multi-Asset Class Index.
A momentum strategy bases investment or weightings within a portfolio on recent performance. The rationale is that observed trends will continue and therefore the index should seek to invest in assets with strong recent growth and reduce exposure or uninvest in those with poor growth over the period. The algorithm can choose a specific time periods such as one month compared with three months to rank asset performance and select those that meet the stated criteria.
The JPMorgan ETF Efficiente 5 and the GS Momentum Builder Multi-Asset Class both give exposure to a range of asset classes through indices or ETFs using a momentum algorithm to determine asset allocation. In addition to momentum these indices seek to maximise portfolio performance by various diversification constraints and volatility control measures with a target of 5%. Within each index strategy offered by these two issuers there are different versions although we will consider each family group rather than drill down to specific indices.
These indices are a natural fit for structured products which can be used to give investors exposure to complex strategies in a relatively lost cost and low risk way although the total fee load on the strategy would expect to be higher than for mainstream indices.
Table 1: Performance and returns (structrpro.com). For live products results use the latest valuations as of 17 Feb 2023.
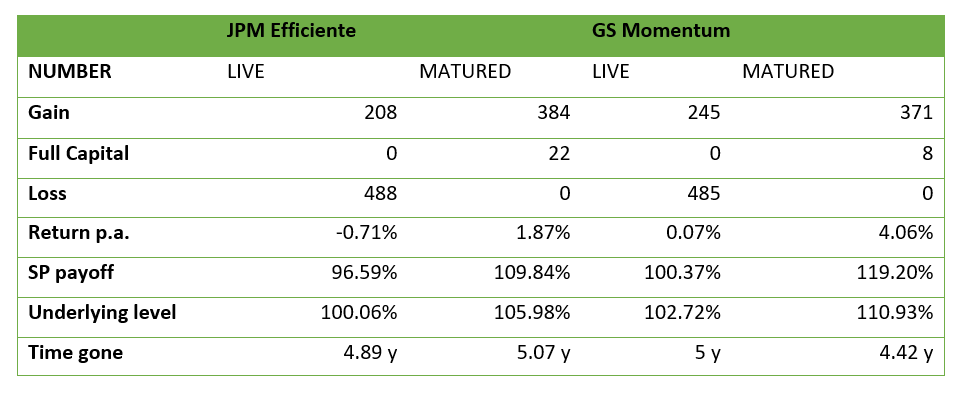
Source: StructrPro
There are over 1100 products linked to each of these strategies with a similar split over live and matured products. The performance statistics shown here were taken from the US structured product analysis service StructrPro.com. StructrPro can be used to analyse live and matured products from the SRP database using analytics powered by FVC.
For both indices, the return p.a. of the matured products is higher than for the live products. All returns are relatively modest due to the low volatility of the underlyings themselves and the capital protection afforded by the most common payoff types (protected growth and growth autocall). Live products can have an in-life valuation of below par which explains the negative return shown here however if held to maturity these products would pay at least full capital.
Fig 1: Scatter chart showing current levels by product and time to go for US products linked to the GS Momentum Builder Multi-Asset Class Index.
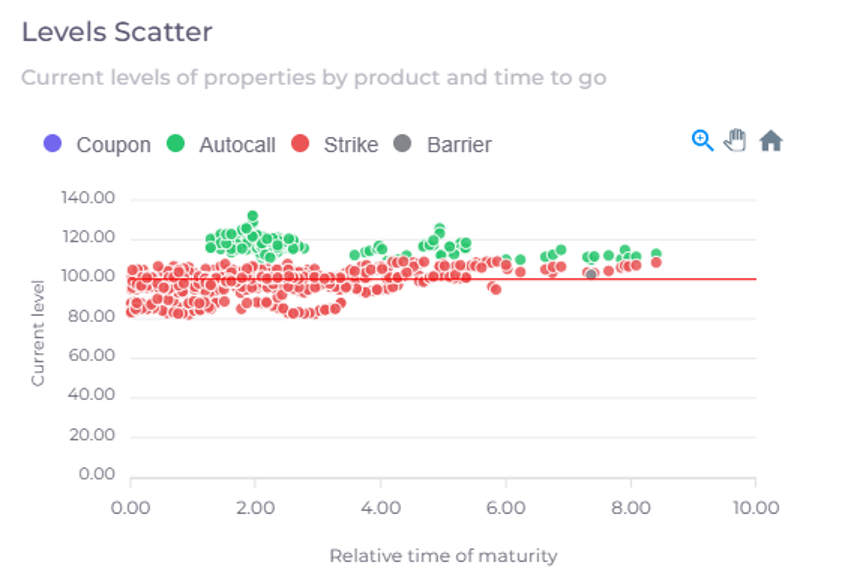
Source: StructrPro
The scatter chart shows the distribution of live products linked to the GS Momentum strategy and key levels for those products. Unlike for capital at risk products the autocall level are usually set above 100% for products linked to these indices. Therefore, a rise in the index is required to call which makes a call less likely. The average initial autocall level for this strategy is 113.41% and 115.06% for the JP Efficiente.
Fig 2: 10-year performance of GS Momentum and JPM Efficiente. The chart also shows the USD 5-year risk free rate on the right-hand scale.
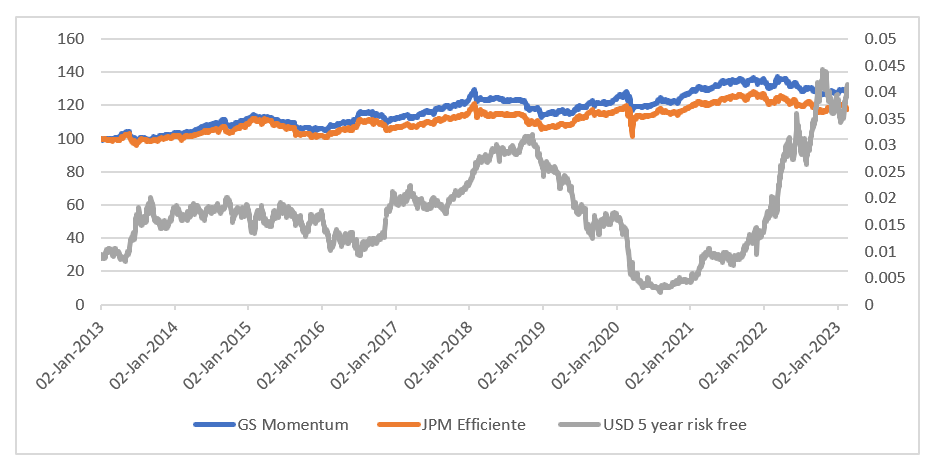
Source: StructrPro
All of the products analysed linked to these underlyings are capital protected. This type of underlying is targeted at risk adverse investors looking to gain exposure to market growth whilst keeping volatility low at approximately the target level of 5%. These strategies therefore are well suited to principal protected payoffs which further reduce the risk to the investor.
These indices are designed to be low volatility and low risk which is reflected in their performance in Fig 2. The biggest reverses in the indices over the past 10 years were during the pandemic in 2020 when both suffered sharp losses although they both quickly recovered. The chart also shows the USD 5-year risk free rate.
Where interest rates have been historically low over recent years it has been difficult to price principal protected products with attractive terms. Using a low volatility underlying will mean the options are less expensive and therefore allowing for higher participation and perhaps a more marketable proposition.
Since the beginning of January 2021 interest rates have been rising and therefore, we would continue to expect to see more principal protected products in the market and these momentum strategies would be well placed to be part of that trend.
Image: Newroadboy/Adobe Stock