
Stock linked products are popular in many structured product markets worldwide.
In the US there a large number of such investments and they play an important role providing alternative choices. Analysis of these products is covered by StructrPro, the US structured products analysis platform powered by SRP data using FVC analytics.
Index-linked products remain the most obvious choice for many structured product portfolios, especially for less experienced investors. The US market is dominated by the S&P 500 (present in 47% of products), Russell 2000 (23%), Nasdaq 100 (12%) and Dow Jones Industrial Average (10%). These indices represent different sectors of the US economy. Other indices provide international diversification such as the Eurostoxx 50 (fifth most common underlying at nine percent) and the MSCI Emerging Markets Index.
Using indices simplifies the investment process but many investors will also want to get exposure in single stock-based products. The main reasons for this are product profile and asset allocation.
Volatility levels of single stocks are generally much higher than indices because of the effect of diversification in an index. This gives the opportunity for ambitious yield generating capital at risk products, particularly when worst-of combinations of stocks are used.
The income autocall in particular is extremely popular in single stock linked products. In order to control risk to provide a long-term approach and to avoid regulatory and legal mishaps the market has generally stuck to well-known stocks and appropriate barrier levels. Typical yields are 11% rather than 7% for single index linked products. The average barrier and coupon barrier level for single stock products is set around 60% which given maturities of one to two years is generally a sensible level.
Asset allocation for stock linked products is critical. As soon as an investor makes a choice to move into single stock-based products selection and diversification needs to be properly planned. Any investor whose portfolio size does not make it practical to invest in a wide array of products must accept higher risk or else restrict the usage to a small percentage of the portfolio. The most common stock underlyings in the US market are Apple (present in 30% of recent stock-based products) and Tesla at 28%. Other choices include Bank of America, Amazon, Alphabet, Exxon, Meta and Netflix.
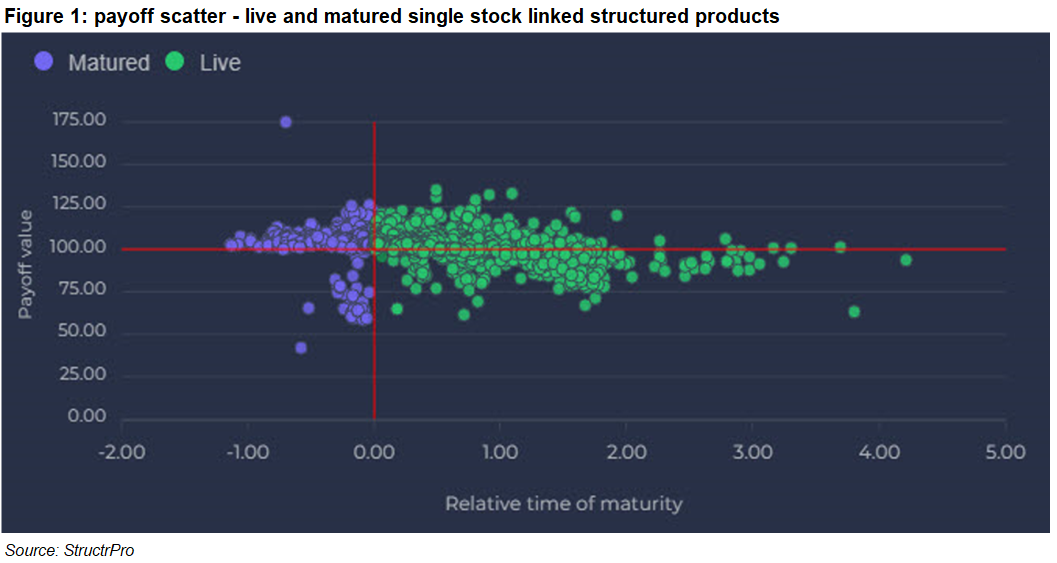
Tracking portfolio structured product performance divides fundamentally between live and matured product sets. This is particularly true in the early years of a portfolio or pipeline where early maturities are associated with positive performances because of autocalling.
Generally, investors will pay more attention to performance of matured structured products and there is also more industry data on products that have expired. However, in any portfolio it is important to communicate the ongoing performance of live products and understand the connection between secondary market valuation, the current level of barrier protection and the likelihood of capital return and any upside payment.
Many products in this set matured with a profit, a fine example being one linked to Tesla. The product paid monthly income totalling 24.1% over its one-year term, only missing one monthly coupon out of twelve. It had a 60% final barrier, but Tesla stock finished at 69% and did not call in its lifetime since the stock was below 100% at those dates, which worked well as the high income was paid for longer.
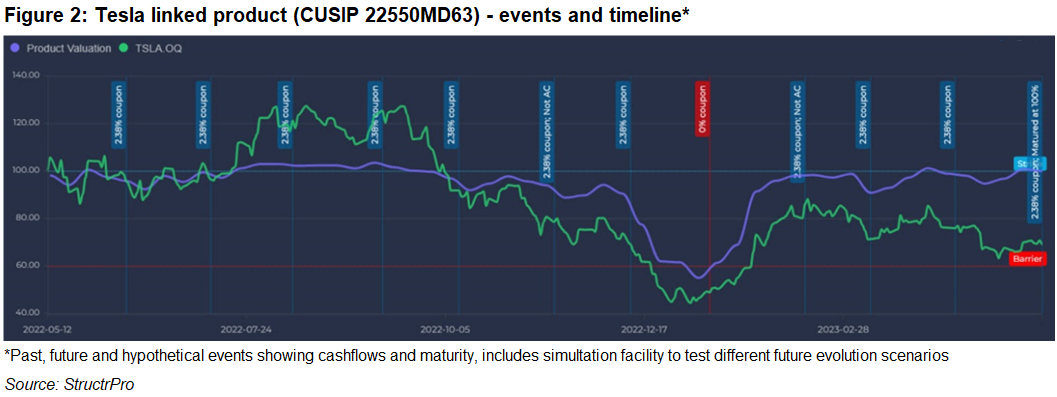
The product valuation is shown by the purple line with the income to be added on top giving a total payoff of 124.1%, almost double where the stock finished giving a very high outperformance.
The green dots in figure 1 show the current valuation and expected maturity of the live products. Those that are below the 100% line (some 346 out of 1200) are there because the potential impact of capital loss weighs heavily on the valuation.
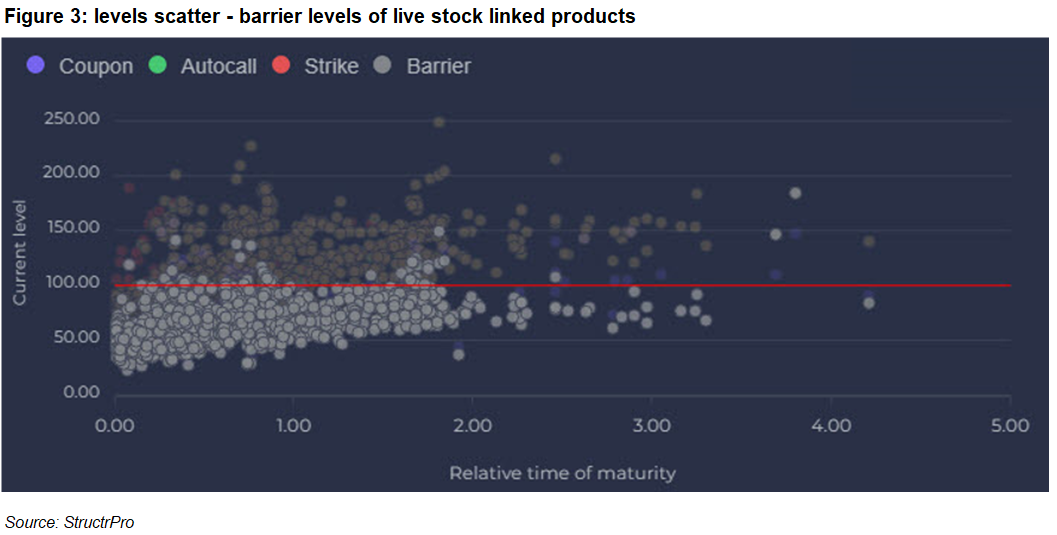
However, an examination of the barrier levels in figure 3 show that most of the products lie below the 100% line meaning that unless the respective underlyings fall further capital will not be lost. This reassuring position can be used to communicate possible outcomes to the investor rather than simply rely on current valuations.
While single stock products are always more varied and somewhat riskier, they remain a valuable sharpener to any portfolio if used carefully and in moderation.
Image: Vectorfusionart/Adobe Stock.