
Standard option pricing models in finance, like the Black-Scholes model, would suggest that call returns are positive, and that call returns should be higher, the higher the strike of the option.
However, research suggests that this is not necessarily the case, at least when it comes to index options, such as with the S&P 500 as underlying.
When an out-of-the-money call goes in the money, this is, on average, accompanied by an increase in market volatility, which investors may not like - Tobias Sichert
In their research, Returns of claims on the upside and the viability of U-shaped pricing kernels, published in the Journal of Financial Economics (2010), Bakshi, G., D. Madan, and G. Panayotov show that this is true for in-the-money and at-the-money options, but that there is a turning point just at the money, and average out-of-the-money call returns are decreasing in their strike.
There is a huge debate on why this is the case when it comes to index options—why is that there is this turning point, where call returns start to turn negative, somewhere a little bit out of money, and they decrease the further out of the money they go? One explanation is that investors may overestimate the call payoff (and not understand the results of their actions) and hence their willingness to also overpay creates the turning point. With out-of-the-money calls being inexpensive (as low as tenths of a fraction of cents on the dollar), investors might then use them as gambling objects.
The alternative view, which is also the view in our paper, is that there is some volatility risk involved that is priced in and that makes expected call returns negative. So, for example, when an out-of-the-money call goes in the money, this is, on average, accompanied by an increase in market volatility, which investors may not like. For instance, if the VIX goes through the roof, option traders may become more risk averse and demand a risk premium as a result.
With the above past research on index options, we were inspired to see if the same result holds true of single stock options. Would returns turn negative the further out of the money the call, as with index options? Does the general average statement hold for the average stock? And are single stocks and index options integrated, in that they maintain the same underlying pricing mechanisms, or not?
In our paper, The Shape of the Pricing Kernel and Expected Option Returns, we investigate a universe of single stock options with data from OptionMetrics IvyDB US. The data contain information on the entire exchange-traded US single stock options market and daily closing bid and ask quotes, as well as implied volatility, greeks, trading volume, and open interest. OptionMetrics does a great job of cleaning high-quality data covering the CBOE, as the largest active options market.
We use data from January 1996 until December 2017. We applied a series of standard data filters to the options data. Since we are interested in reliable prices of deep out-of-the-money options, we excluded options with very low prices, i.e., options that have a best bid of zero or a mid-price below 1/8$. In addition, we exclude options which violate standard no-arbitrage bounds. We also obtained return data for the underlying stocks from CRSP and accounting data from Compustat. Our final sample, on average, each month contains options on about 1500 different underlying stocks.
We test the main hypothesis regarding the behavior of call returns with increasing moneyness using a simple sorting procedure. We first define moneyness bins (call strike price/current stock price) to normalize for different levels of stock prices: between 1% and 2% out of the money, between 2% and 3%, and so on. Then, each month, we sort call options by their initial moneyness, and track their returns. We repeat this same procedure every month to get a statement on how out-of-the-money call returns are on average.
Call returns out of the money
Just as Bakshi et al. (2010) show for S&P 500 index options, we discover that, on average, the further out of the money the call, the lower its average return. While average at-the-money call returns are positive, call returns start decreasing in moneyness once the strike is about 5% higher than the current stock price, and even turn negative at about 10% out of the money. In other words, the higher the strike relative to the current price of the underlying, the lower the call return on average. We also investigate whether this finding is confined to any identifiable subset of stocks, but do not find any category of stocks (size, book to market, etc.) where these results would not be observed.
We then further investigate the implications of these findings for existing results. For example, Hu and Jacobs (2020) document that at-the-money, expected call returns are decreasing in the volatility of the underlying stock. So, the higher the volatility of the return of the underlying stock, the lower on average the call return will likely be.
We extend their analysis to out-of-the-money call options and find that here the relationship flips.
We show that out-of-the-money, call returns are more negative the lower the volatility of the stock, or equivalently, the higher the volatility of the stock, the higher the average call returns. This may sound counterintuitive, since the higher the volatility of the stock, the higher the price (all else equal), and hence one might expect a lower expected return. However, for out-of-the-money calls, the opposite is true. The higher the volatility and hence the price are, the higher the return are on average.
Takeaways
What does this mean for traders and other investors? The most obvious implication for an option trader is that he or she should be aware that buying an out-of-the-money call is a negative return investment on average. While these calls may appear cheap in dollar terms, the further out of the money they are, they may be fairly expensive when it comes to returns. Their expected returns are highly negative, making them expensive in a relative sense.
Investors should instead consider out-of-the-money calls as a hedge instrument, versus buying these stocks in hopes of an increase in returns.
Consider the following graphs, which show the results of our analysis.
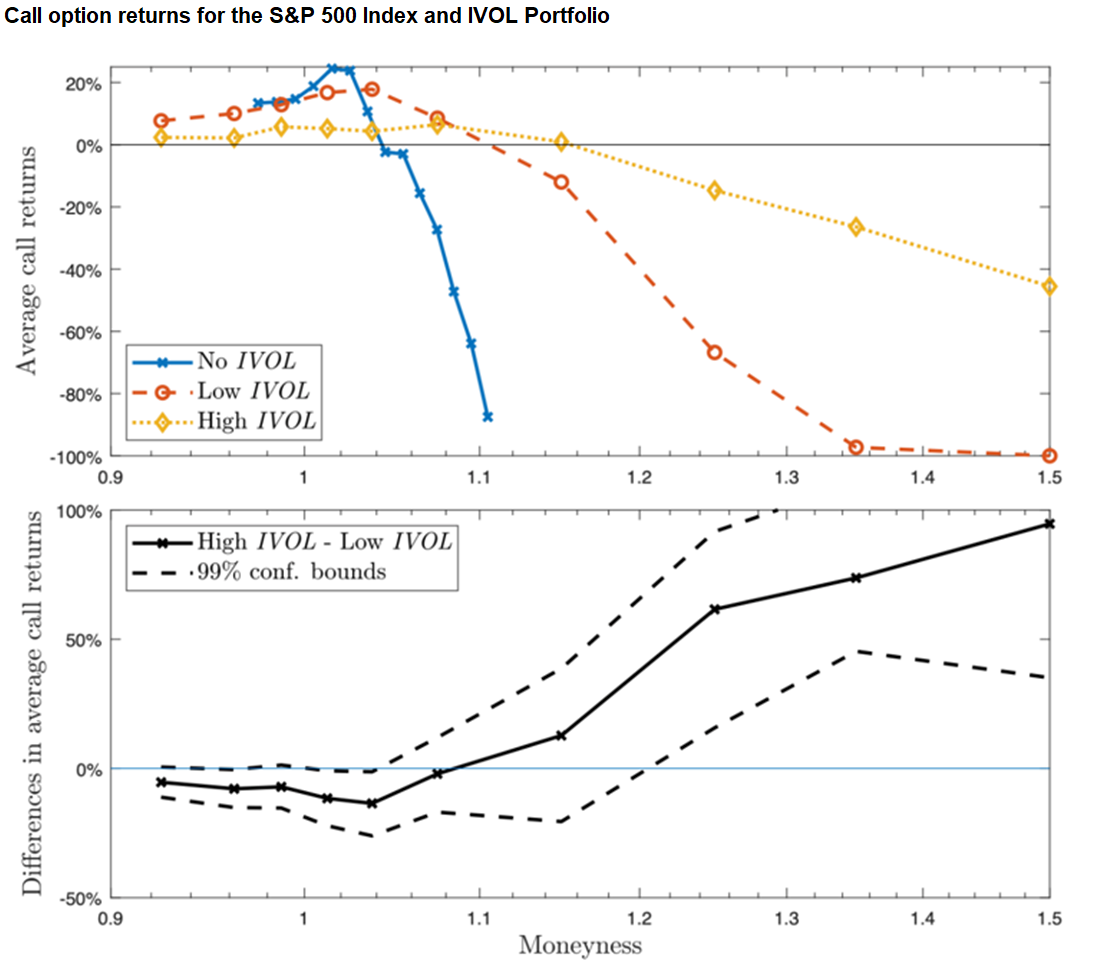
The figure above shows the average call returns on the Y axis, and moneyness of the stock call options on the X axis.
On the first chart, the blue line represents calls option returns for stocks with no idiosyncratic volatility (IVOL, or company/stock specific risk). In this case, it is the S&P 500. The other lines are stocks with very low (orange) and very high (yellow) idiosyncratic volatility, or total volatility, respectively.
On the second chart, we show differences in average call returns between stocks with very low and very high idiosyncratic volatility (the orange minus the yellow line of the first chart). The dotted lines are confidence bounds, that show that the difference is statistically different from zero in most cases, and not just noise.
You can see two patterns. The first observable pattern in the first chart is that out of the money, the returns for all three types of stocks turn negative. They are below the black reference line of 0, but the returns are higher for high volatility (i.e., less negative) stocks.
The second observable pattern that can be noted in the second chart is that: while average returns are higher for high volatility stocks initially (i.e., in the money), this pattern reverses out of the money (and at around the money).
Tobias Sichert is an assistant professor of finance at Stockholm School of Economics and Swedish House of Finance. He holds a PhD in finance from Goethe University Frankfurt. His research focuses on asset pricing, financial economics, and financial econometrics.