Over the last two years the larger underlyings have continued to dominate the notional going into structured products which continued to beat their referenced assets even after times of market disruption.
StructrPro is a US structured products data service that covers live and matured products from the SRP US database using analytics powered by FVC. Performance statistics for individual products and portfolios are the main focus of StructrPro however the data behind this application allows us to examine trends in the market. We will focus on the underlying assets linked to US structured products.
The following analysis has been extracted from StructrPro and covers products striking since January 2021. Products are grouped into six-month periods and the products within each period can then be group into categories of different criteria. The notional amounts are provided by data from structuredretailproducts.com.
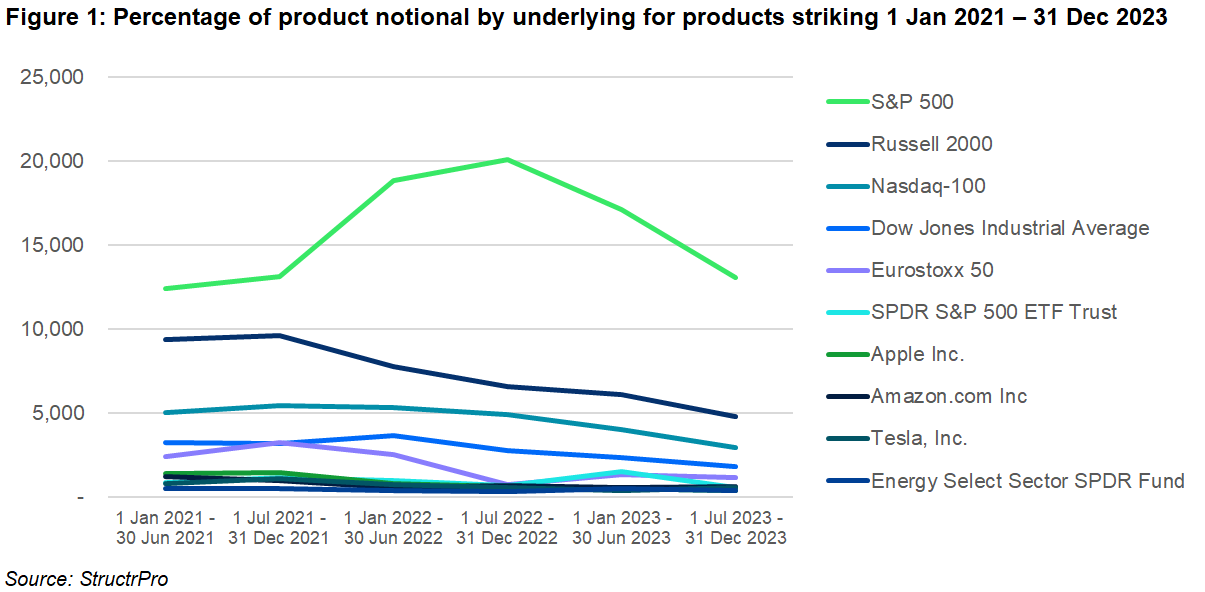
Figure 1 shows the top 10 underlyings by product notional for products striking in the US for the period 1 January 2021 to 31 December 2023. The top 5 underlyings by notional amount are all indices with the S&P 500 being the largest making up approximately 32% of all US issued products. Also featuring in the top 10 are two exchange traded funds (ETFs) and three US stocks - Apple Inc, Tesla and Amazon.
Major benchmark stock market indices are consistently the most popular underlyings in the US and are used in products either as the sole underlying or as part of a basket.
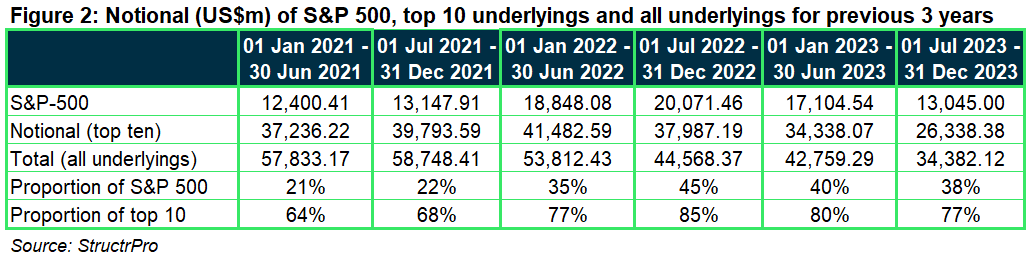
The table in Figure 2 shows 2021 had to two highest periods of overall notional amount in the US. When the market was recovering from Covid-19 there was a sharp increase in both the number of products issued and sales volume.
During this period the spread of underlyings was greater than for subsequent periods and the proportion of products linked to the top ten was lower than for the other four periods although still over 60%.
Over the past two years the number of products linked to the larger underlyings has been higher and between 77%-85% of notional with the S&P 500 accounting for 35%-45% of products over the same period.
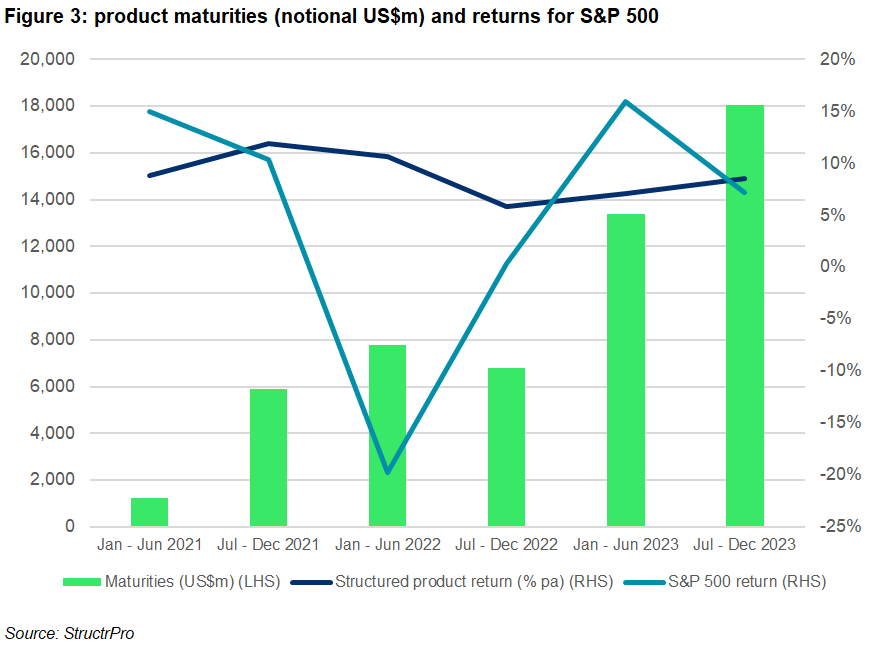
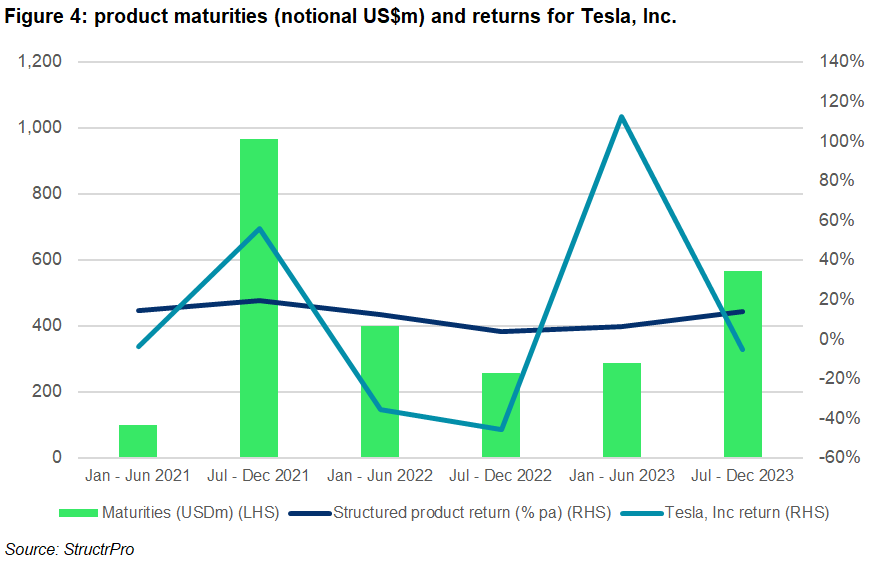
The two charts in figure 3 and 4 show maturities by notional amount for structured products linked to the S&P 500 and Tesla during the past three years.
The charts also show average returns for structured products linked to the underlying asset and the performance of the underlying return itself for the same period.
The S&P 500 is the largest underlying in the US structured products market and so always has a large amount of maturities however as the chart shows when the underlyings has a positive return more maturities tend to occur.
This is due to the high proportion of products with an autocall feature. The chart also shows how the product returns and underlying returns do not necessarily perfectly correlate. The period 01 January 2022 – 30 June 2022 saw the worst performance of the index itself with a fall of almost 20%. However, the structured product return for the same period exceeded a growth 10%. This is due to mostly to the duration of the products and also the type of product payoffs used.
The second of the two charts shows maturities and returns for products linked to Tesla. This was chosen as it had the highest average structured product return out of the top 10 underlyings over the six periods.
The period with the largest number of maturities for this underlying was July 2021 - December 2021 which coincided with the highest point of Tesla stock price.
Although maturities were higher during the underlying peak the average return of structured products maturing at the time was similar to the return of other periods. This is due to the typical fixed maximum yield nature of the vast majority of stock-based products.
Equity trends and performance are widely discussed and analysed. This data presented here aims to give insight into how equity trends feed back to the structured product market and performance.
Keeping abreast of patterns enables stakeholders to monitor the market and how it performs in different environments.
Image: Bigc Studio/Adobe Stock.