
In this article we look at how the risk profile of structured products change when barrier options were triggered and how monitoring the Greeks can help identifying opportunities and relevant market signals for the issuance of structured products.
In the second part of the article 'Extracting, Aggregating and Enriching' the option Greeks, we look at data enrichment aspects by aggregating Delta, Gamma and Vega across the structured products associated with a specific underlying - whether a stock or a stock index, covering one or more countries or regions.
Current Greeks situation and stress simulations
Future volatility remains the great unknown in options, though other uncertain risk factors may become significant at specific times. Volatility can spike to unsustainable levels - as observed in large-cap equities in developed markets like the U.S. at the end of the Great Financial Crisis (2009) - before reverting relatively quickly.
Volatility typically exhibits mean reversion and varies across puts, calls and different option strikes
Moreover, volatility typically exhibits mean reversion and varies across puts, calls and different option strikes. In other words, unless a perfect hedge using the identical product is implemented, hedging Vega exposures can become highly challenging.
Therefore, understanding the current Vega profile and anticipating its potential changes - whether through stress simulations that “push” key variables or by analysing historical market shocks such as Covid or the 2022 interest rate surge - is essential.
The SRP Greeks platform provides an expanded view of both current and historical aggregated Greeks, broken down by individual underlyings - including Vega - to establish a solid foundation for risk simulations. These scenarios can then be analysed in the context of one’s own portfolio and the specific dynamics of the structured products market, ensuring that risk is reassessed more comprehensively and not inadvertently underestimated.
Stress-testing based on historical situations
The SRP Greeks platform also allows users to look back over the past five years to observe how the Greeks evolved during previous stress situations with the structured products issued at those times.
Of course, even a complete aggregation of structured products will only reveal partial exposures, as the current market of issued structured products differs from the past—the global issuing portfolio varies over time. Nevertheless, valuable lessons can be learned from these particular historical situations.
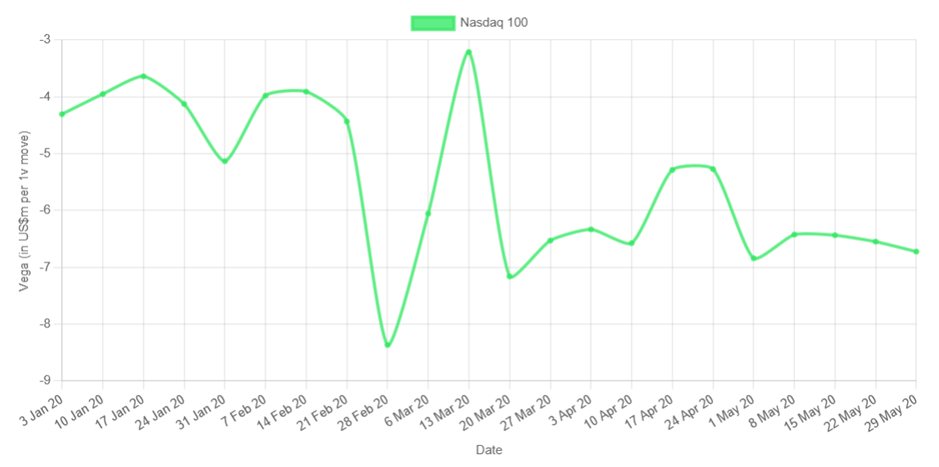
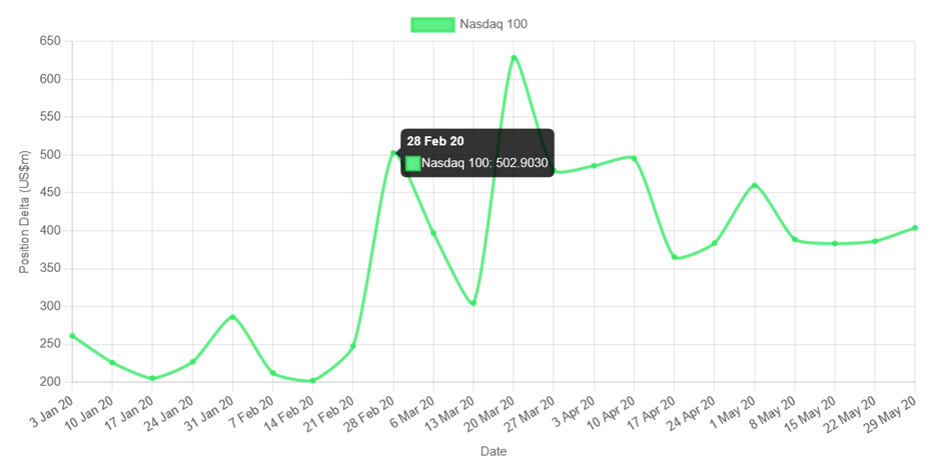
The graphs below show the evolution of some Greeks for Nasdaq-linked structured products worldwide - the largest issued products according to the database used - during the early stages of the Covid pandemic.
Chart 1
Source: SRP Greeks
Chart 2
Source: SRP Greeks
The graphs show a peak in absolute Vega on 28 February and 20 March 2020 (with the actual closing low on 20 March 2020), coinciding with two peaks in Position Delta (on a weekly basis).
The risk profile changed between these dates as barrier options were triggered (Knock-In): 21 products affected according to the SRP database. From 20 March 2020 on, the market began a strong recovery. Notably, the Vega risk more than doubled in a very short period, a critical point to remember in this stress scenario.
Identifying opportunities or relevant market signals (such as a form of “confirmation” – comparable to Technical Analysis – for the issuance of structured products)
When overall risk is increasing, executing a market transaction that contributes to risk reduction may often be achieved at more favorable prices. In other words, rising risk can create potential opportunities; conversely, when risk is already elevated, additional cost premia typically emerge. Naturally, the feasibility also depends on the current depth and representativeness of the structured products market. Let’s present two cases:
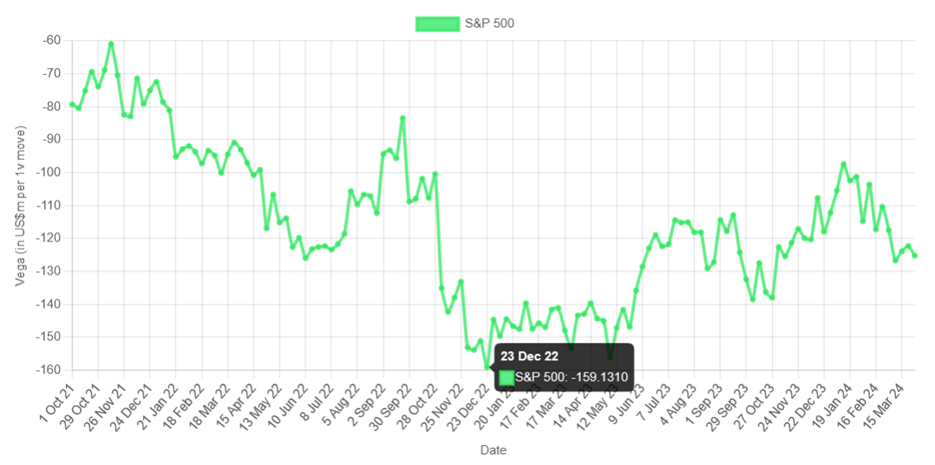
The graph below illustrates how Vega risk peaked at year-end 2022, during the period of significant US interest rate hikes. On 23 December 2022, the VIX stood at 20.87% (closing) - still relatively low given the circumstances - while the S&P 500 closed at 3.844.82.
This presented a potential opportunity for the issuance of S&P 500 call warrants with positive Vega exposure at attractive pricing. By 29 December 2023, the S&P 500 rose strongly to 4.769.83, while the VIX had declined to 12.45%.
Chart 3
Source: SRP Greeks
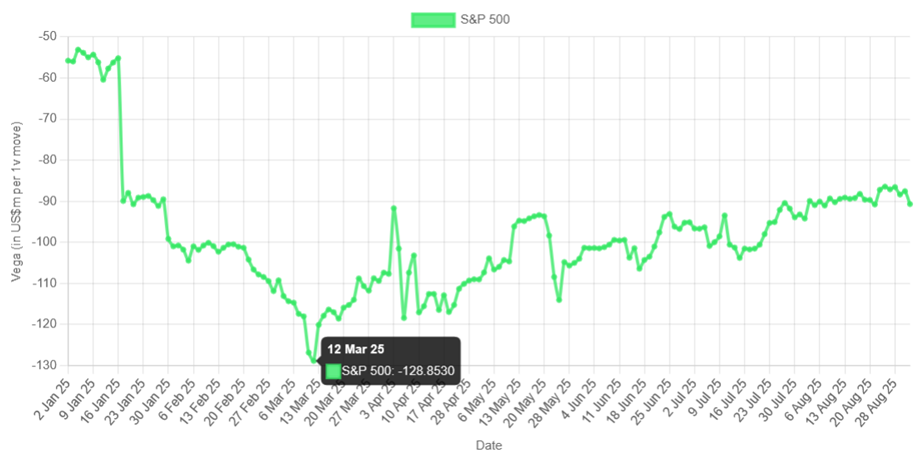
The graph below shows the maximum Vega risk on 12 March this year: while the Vega risk was still high at the moment of the highest VIX value on 8 April 2025, it actually was (quite) smaller than on 12 March.
That matches the low of the S&P500 at 4.982.77 (on 8 April). This was a potential opportunity to issue a Reverse Convertible on the S&P500 that would have had a negative Vega (so, a Vega risk increase but from a lower level), at an optimal price.
Chart 4
Source: SRP Greeks
There are also cross-asset hedging opportunities worth considering – for example, hedging equity risk through interest rates.
Such an opportunity arose in the late 1990s, when the Tech Bubble was expanding rapidly and extensively. A Structured Products Risk Business Intelligence (RBI) analysis would most likely have confirmed that hedging directly with an equity-linked structured product was prohibitively expensive.
In contrast, warrants on short-term interest rates - based on the view that rates would decline in the event of a market crash - offered a much more attractive pricing solution at the time. The author of the article indeed went on to launch such a tailored structured product.
“Jump over the barrier and back” strategy
Let’s conclude with the relatively straightforward case of a cumulation of short down-and-in put options on a specific stock around similar barriers. In this scenario, the stock on a downward move could experience an acceleration of losses as it approaches and breaches the barrier(s), followed by a strong countermove.
A potential trade - selling high and buying low the stock, then buying low and selling high - would be of particular interest to a hedge fund employing a systematic approach. This ‘jump over the barrier and back’ strategy will be discussed in detail in our next article!
Image: Who is Danny/Adobe Stock
Disclaimer
- This content is not intended as a solicitation or an offer; it is provided solely for informational purposes to professional investors
- The information presented herein has been prepared with great care; however, errors may still occur