Using backtested data sets can be useful for traders to gain extra insight.
For traders evaluating investment strategies, a popular way to start testing is by looking at a large volume of historical data.
Through historical data analysis, traders can identify weak points in their strategies and refine parameters, thus gaining confidence in their proposed algorithms
In the case of the rich data that is contained in the SRP Greeks application, traders can examine strategies with backtested data before making live trades.
Through historical data analysis, traders can identify weak points in their strategies and refine parameters, thus gaining confidence in their proposed algorithms. The analysis examines five years of data from January 2020 through to December 2024, covering major global indices like S&P 500, Nasdaq, Russell, Kospi, Hang Seng and Nikkei. It examines first-order Greeks, including Delta, Gamma, Vega and Theta, as well as second-order Greeks such as Vanna and Charm to provide comprehensive information about structured products market-wide sensitivities.
This time period covers unusual events in the markets that will subject any strategy to a severe test, for example, the Covid-19 crash of 2020 with its pronounced volatility increases, large-scale monetary and fiscal easing. Another testing period was the inflationary pressures of 2022 that were immediately followed by rapid interest rate hikes and changes in volatility regimes.
Key sensitivities
Although advanced trading requires a deeper understanding, most options analysis is based on the traditional Greeks (Delta, Gamma, Vega and Theta). Second-order Greeks like Vanna, which links Delta and Vega sensitivities and Charm, illustrates how Deltas change over time and are crucial for managing exposures in dynamic markets.
Traders who relied only on the first-order Greeks saw their hedges prove insufficient during substantial fluctuations of the 2020s because Vanna and Charm increased risks beyond what was suggested by traditional models.
This diverse global dataset includes international markets as well as US indices (SPX, NDX and RUT) tested across different markets and regimes. From Figure 1, the US indices saw a significant divergence between the start of 2020 to the end of 2024. The Nasdaq rose to 237% of its initial value and the S&P 500 rose to 181%. By contrast, the Russell only grew to 134%, thus significantly underperforming the two other indices.
This emphasises how strategies should be tested across several indices even within a single market.
Figure 1: Rebased US indices (SPX, NDX, RUT) performance between Jan 2020 to Dec 2024
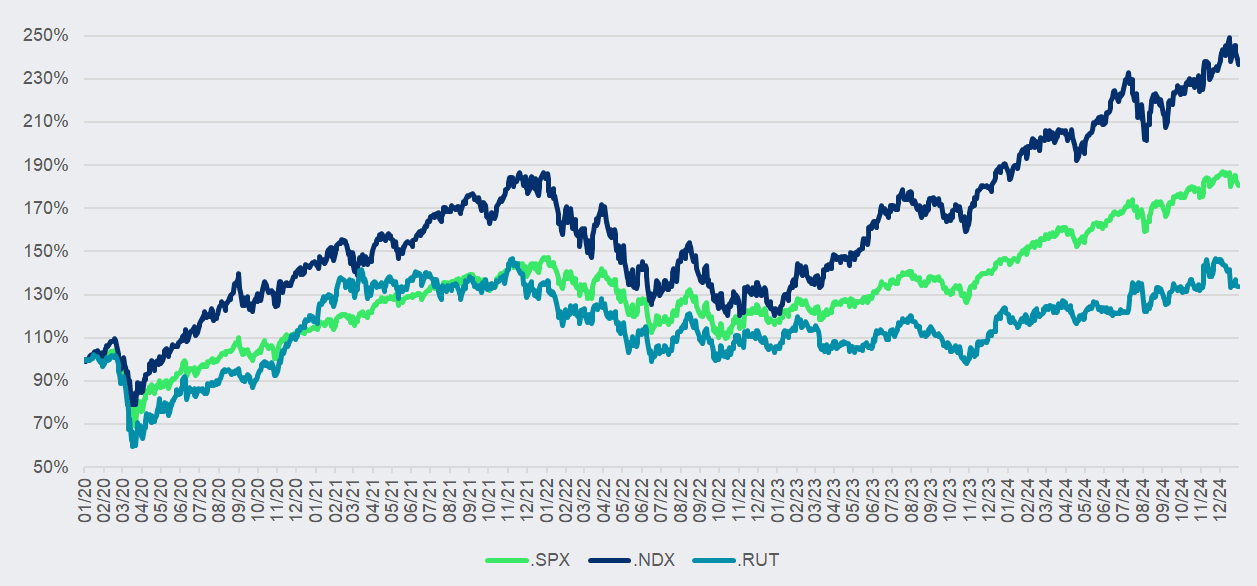
Source: Refinitiv/FVC
The Asian markets' rebased chart (Figure 2) shows marked regional differences driven by Covid-19 measures, regulatory pressures, and geopolitical tensions.
During the Covid-19 outbreak in Asia, the Nikkei and Kospi reached their lowest levels in the backtesting period, at ~71% and ~68% respectively on 19 March 2020. Both indices subsequently recovered, with the Nikkei rising to ~182% by July 2024 and the Kospi to ~152% by June 2021.
In contrast, the Hang Seng declined to roughly 44% in October 2022, reflecting the impact of strict pandemic policies. These differences illustrate the usefulness of testing global, since the environments of the US, Europe and Asia are quite different.
Figure 2: Rebased Asian indices (N225, HSCE, KS200) performance between Jan 2020 to Dec 2024
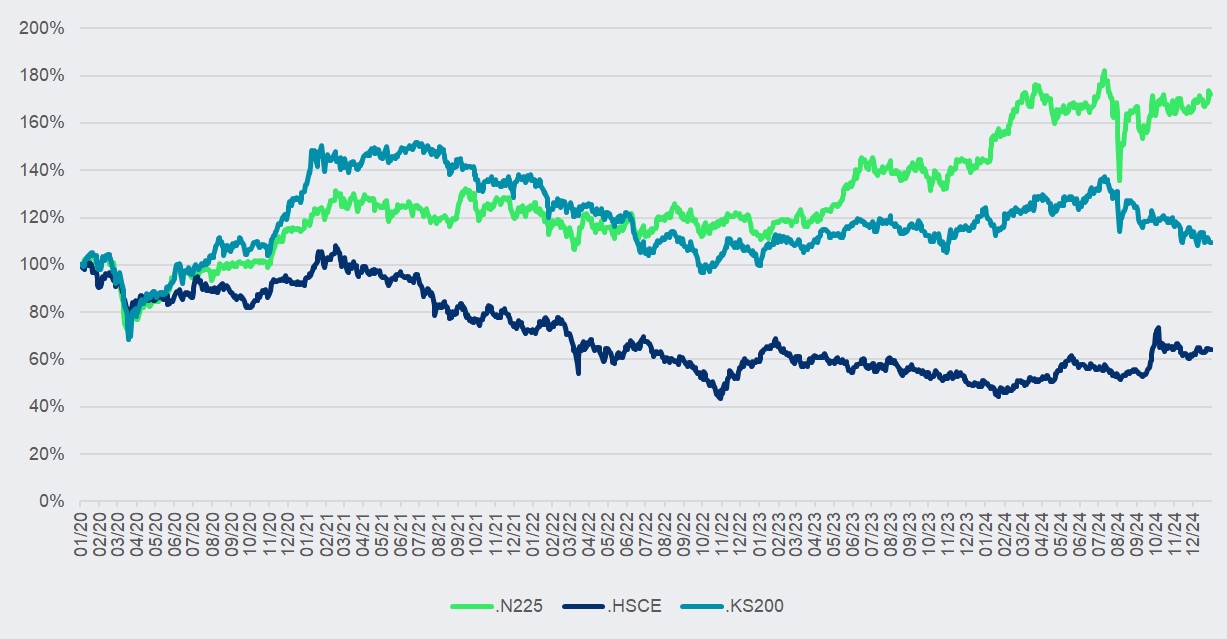
Source: Refinitiv/FVC
US and Asian markets
As part of this service, Greeks analysis is provided across three main US indices. Each index is quite different, and this will affect structured product sensitivities. The S&P 500 comprises large-cap stocks and hence offers broad exposure and a balanced risk-return trade off.
Since Nasdaq represents mostly technology companies, it gets affected by changes in outlook and rates, especially, thus forming uncommon volatility patterns. The Russell 2000 represents smaller companies which can react sharply to market stress.
Second-order Greeks matter in market volatility, as clearly seen from the Position Delta and Position Vanna charts in Figures 3 and 4.
Vanna effects indicate how Delta is sensitive to changes in volatility. In volatile market scenarios, these effects can greatly impact portfolio risk. With an understanding of the interplays within various Greeks, hedging strategies and following market trends can be done more accurately.
Figure 3: Position Delta between Jan 2020 to Dec 2024
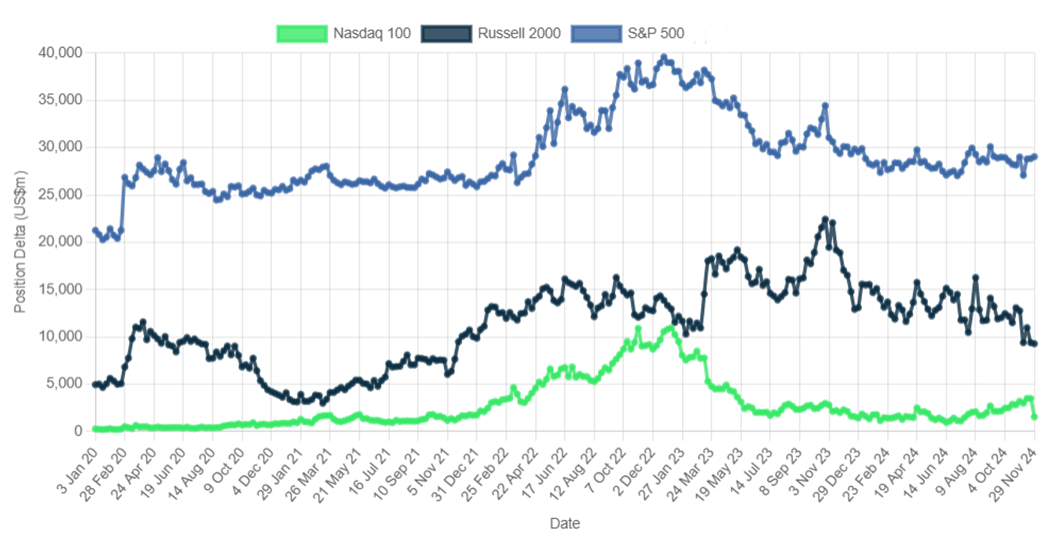
Source: SRP Greeks
Figure 4: Position Vanna between Jan 2020 to Dec 2024
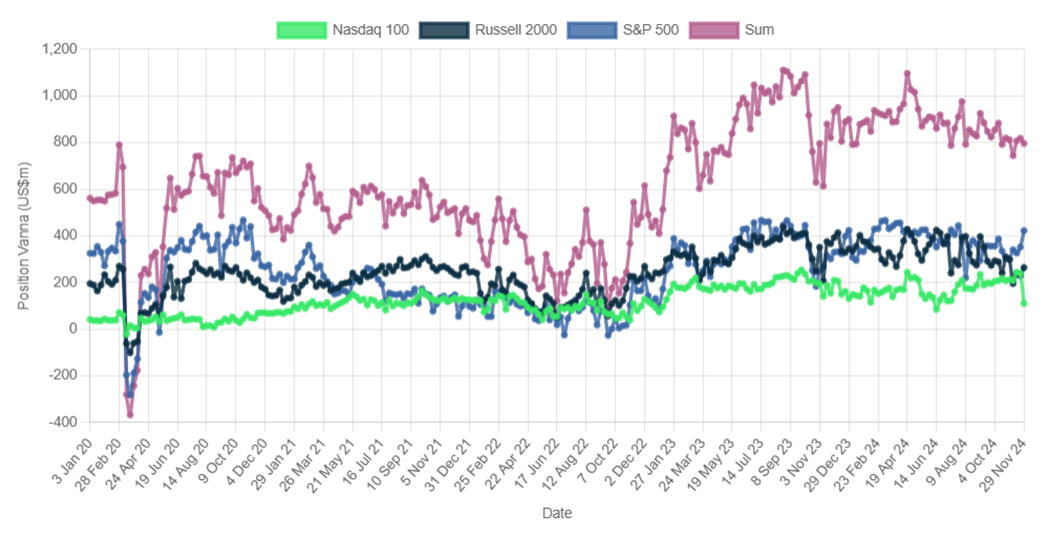
Source: SRP Greeks
In Figure 5, Theta charts for Asian markets reveal some interesting risk profiles. Hang Seng showed the most volatility on the back of Chinese regulatory crackdowns and Covid-19 restrictions. The Kospi, meanwhile, with its export-oriented economy coupled with the choice of products in that market mean that the Theta exposure is steadier.
Position Charm (Figure 6) further draws out further interesting data. Charm is necessarily a very changeable quantity as it predicts changes in delta expected in the short term if there is no market movement. It will therefore be affected by maturities and autocalls. The charts emphasise the need for Asia-specific strategies that take export dependence, policy uncertainty and currency risk into account.
Figure 5: Theta between Jan 2020 to Dec 2024
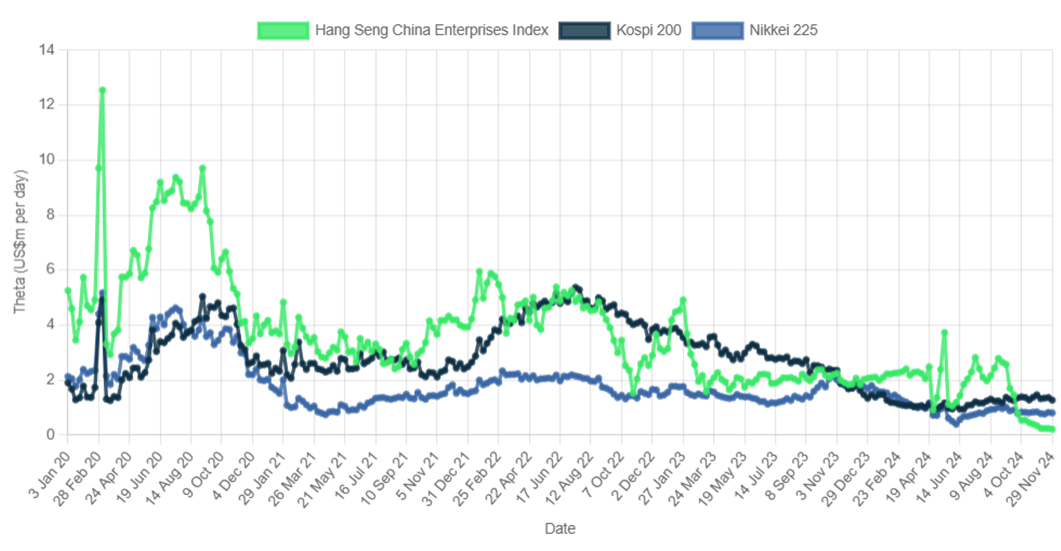
Source: SRP Greeks
Figure 6: Position Charm between Jan 2020 to Dec 2024
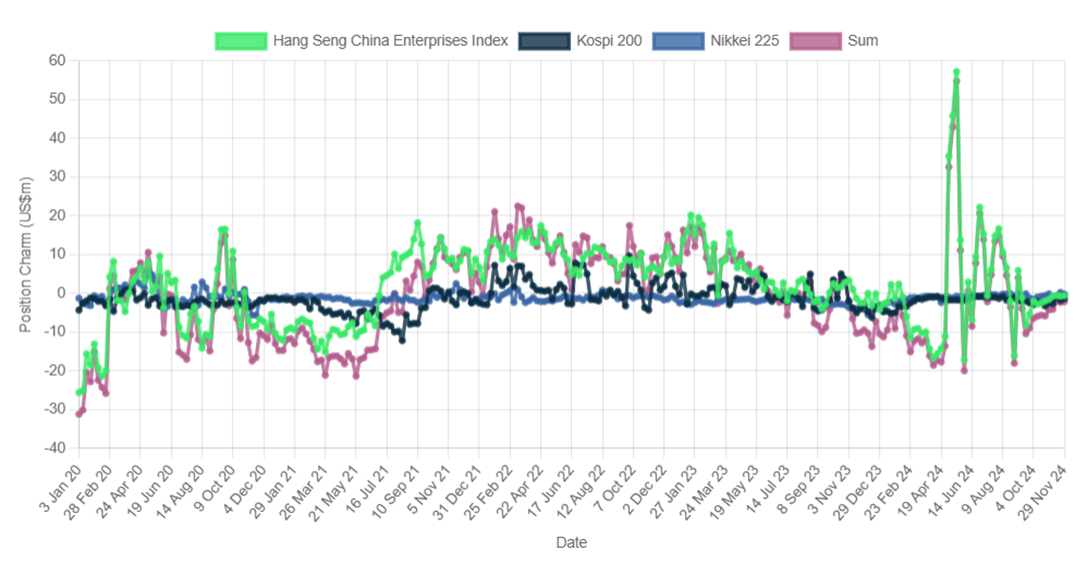
Source: SRP Greeks
For hedge funds and banks, the use of full Greeks data across global indexes promotes better risk management and taking advantage of market opportunities.
Image: Maximusdn/Adobe Stock
SRP Greeks is a comprehensive platform for structured product analysis and risk management that offers daily sensitivities across different Greeks (such as Delta, Gamma, Vega, Theta, Vanna and Charm).
The platform helps institutional users identify market shifts and value opportunities, improve hedging strategies and make better risk-based decisions for a number of important underlyings, including the S&P 500, Eurostoxx 50, Kospi 200, and stocks Nvidia and Tesla. Detailed metrics and five years of back-tested data further enhance its utility for portfolio risk monitoring.