
This fourth article explores the “jump over the barrier and back” strategy specifically within the framework of barrier reverse convertibles (BRCs).
This strategy provides critical elements to understand market behaviours and risk dynamics associated with BRCs. Moreover, it represents a key component of business intelligence at the structured products level, providing valuable insights for risk managers and investors alike. By analysing this strategy in detail, the article aims to enhance comprehension of the underlying mechanics and contribute to more informed decision-making processes when dealing with complex structured products.
The analysis will focus on Nvidia as the BRC underlying.
The option’s parameters on 5 May 2025 are – the option is embedded in the BRC: Stock price (end of day): 113.82 USD, Strike: 101.89 USD, Barrier: 56.05 USD, Expiration: four months, Risk-free: 4.35% (estimated), Volatility: 40.32% (estimated). Dividends are ignored.
The table below shows the Greeks for one share at different spot prices – all else remaining the same: our own valuation
| Instrument (about) | Stock closing | Value | Delta | Gamma | Vega |
| Short down-and-in put | 113.83 (real) | 0.1243 | 0.0153 | -0.0019 | -0.0324 |
| Short down-and-in put | 95.00 (down) | 0.19 | 0.1375 | -0.0151 | -0.1826 |
| Short down-and-in put | 75.00 (sharply down) | 10.114 | 0.9682 | -0.078 | -0.5791 |
| Short down-and-in put | 58.00 (near barrier) | 39.598 | 2.4319 | -0.0446 | -0.1493 |
| Short down-and-in put | 56.00 (at barrier but 5 cents below) | 44.457 | 0.9916 | -0.0017 | -0.0074 |
| Short down-and-in put | 54.00 (round 2 dollars below barrier) | 46.444 | 0.9946 | -0.0012 | -0.0048 |
Now, we take account of a likely increase in volatility to 50% or even 60% (annual volatility) while the stock falls. The table looks like as follows:
| Instrument (about) | Stock closing | Volatility | Value | Delta | Gamma | Vega |
| Short down-and-in put | 95.00 (down) | 50 | 0.19 | 0.1375 | -0.0151 | -0.1826 |
| Short down-and-in put | 75.00 (sharply down) | 60 | 10.114 | 0.9682 | -0.078 | -0.5791 |
| Short down-and-in put | 58.00 (near barrier) | 60 (instead of 40.32%) | 41.834 (higher) | 1.5389 (lower) | -0.0169 | -0.0977 |
| Short down-and-in put | 56.00 (at barrier but 5 cents below) | 60 (instead of 40.32%) | 44.910 (higher) | 0.9348 (lower) | -0.0065 | -0.0411 |
| Short down-and-in put | 54.00 (round 2 dollars below barrier) | 60 | 46.792 (higher) | 0.9471 (lower) | -0.0058 | -0.0336 |
By comparing with a plain vanilla European short puts, considering the two levels of volatility, we get of course the same value as the barrier has been hit.
| Instrument (about) | Stock closing | Volatility | Value | Delta | Gamma | Vega |
| Short put | 54.00 (round 2 dollars below barrier) | 40.32 | 46.444 | 0.9946 | -0.0012 | -0.0048 |
| Short put | 54.00 (round 2 dollars below barrier) | 60 | 46.792 | 0.9471 (lower) | -0.0058 | -0.0336 |
Now, we need to see the effect of the expiration: volatility of 40.32%, stock closing at 58.00 (near the barrier). In the following table:
| Instrument (about) | Expiration | Value | Delta | Gamma | Vega |
| Short down-and-in put | 2 months | 38.0288 | 3.5491 | -0.1069 | -0.1989 |
| Short down-and-in put | 4 months | 39.5976 | 2.4319 | -0.0446 | -0.1493 |
| Short down-and-in put | 8 months | 40.1188 | 1.6343 | -0.0223 | -0.1478 |
| Short down-and-in put | 12 months | 40.0863 | 1.2955 | -0.0173 | -0.1833 |
The table indicates that the absolute Delta of the barrier reverse convertible (BRC) increases as the exotic option’s expiration date approaches. A similar pattern is observed with the absolute Gamma, which also becomes more pronounced closer to expiration. This behavior reflects the heightened sensitivity of the option’s price to changes in the underlying asset’s price as time decreases, emphasizing the importance of monitoring these Greeks closely in the final stages before expiration.
In summary, as the spot price approaches the barrier, the Delta of a short down-and-in put increases sharply because the probability of a knock-in rises quickly. At this point, the issuer is effectively long the down-and-in put—which means a negative Delta—so their (the issuer) dynamic delta hedging involves holding a long position in the stock. By buying low and selling high the stock, in response to changes in Delta, the issuer can/shall realise a gain.
Now, if the stock is in a downtrend and approaches the barrier, the likelihood of an acceleration in price movement may increase due to reactions around this critical level, for example. This often leads to heightened volatility and can trigger a rapid shift in market sentiment. Consequently, the decline may be quickly followed by a sharp upward rebound, driven by market participants reacting to perceived opportunities or the establishment of a new technical support near or at the barrier.
In this case the short-seller profits by buying back shares below the barrier, anticipating a potential, spontaneous reversal to the upside. Taking a net long position ahead of the rebound can be the second leg of the strategy—a "jump over the barrier and back."
The option hedger can benefit as well as the exotic option’s Delta (in absolute value) is very high near the barrier, but once the barrier is breached and the vanilla option is activated, Delta drops dramatically (in absolute value). If the stock continues its quick decline and then promptly recovers (clearly) above the barrier, the structured product hedger, having bought more shares at barrier proximity, finds that much less stock is needed for hedging once the vanilla option is live. The subsequent up-move above the barrier allows the sale of excess shares at higher prices—but only if this price jump effectively occurs.
Of course, higher issuance volumes or clustered barrier levels of barrier reverse convertibles can intensify these effects, a phenomenon also observed in FX markets.
Here is how it looked like on 5 May 2025: Nvidia BRCs worldwide
| Share by sales volumes | Sum of sum US$m | |
| Breached the barrier | 1% | 162 |
| within 10% from KI | 5% | 1,092 |
| >10%; <20% from KI | 12% | 2,545 |
| more than 20% from KI | 81% | 16,655 |
| 20,454 |
Source: SRP Greeks
KI: Knock-In (more practiced) / Kick-In
Distance to KI barrier on 5th of May 2025 (Underlying Spot-KI)/Spot
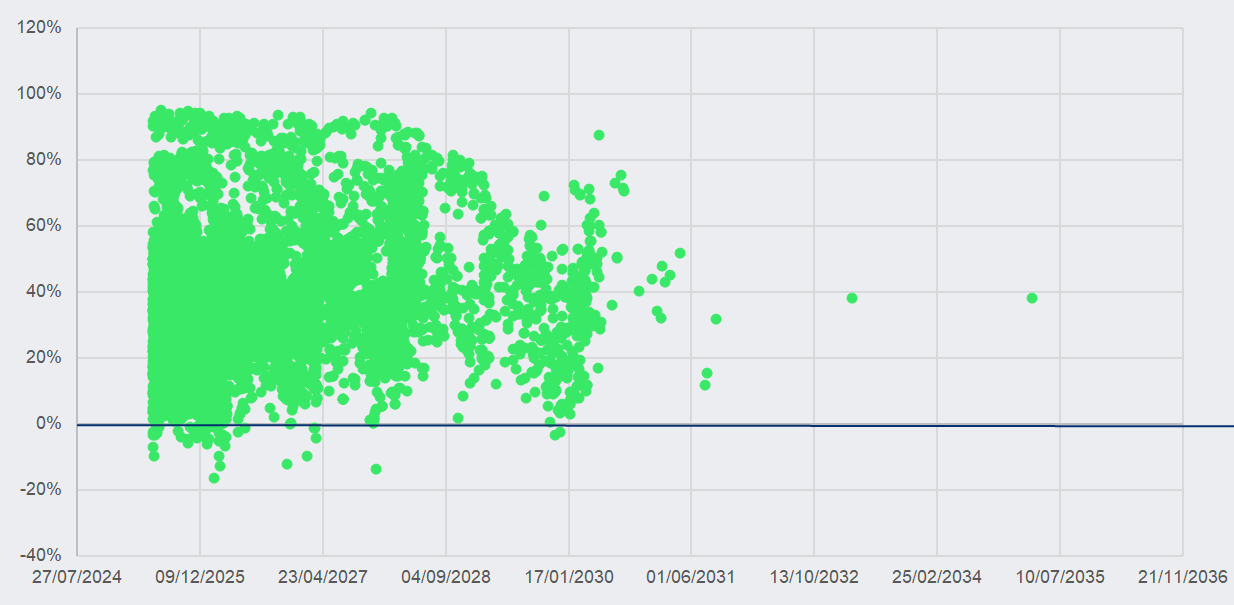
Source: SRP, Investing.com
From the above table, it is clear that the greater the stock’s decline, the higher the volume involved. The graph also shows a concentration of expirations in the shorter term, which is typical when exotic options are involved.
This is Business Intelligence that would allow to develop a hedge-fund type of strategy. Of course, the hedge fund manager still needs to associate a probability of success with the strategy.
The Structured Products Risk Business Intelligence (RBI) from the SRP Greeks platform would then show the positive Position Delta (as it is from the investor side) increasing when more structured product (issuing) volume is “approaching” similar barriers (and decrease again when the barrier is breached).
At the same time, the further away the expiration of the options is, the lower the absolute Delta, as shown above in the table with the different expirations.
The graphs below compare the 2025 drop in Nvidia and the recovery in the following few days to the position Delta (based on the largest issued Nvidia structured products worldwide, according to the SRP Greeks platform):
- Nvidia closing high on 6 January 2025 at: US$149.43
- Nvidia closing low on 4 April 2025 at: US$94.31
Quarterly results published on 26 February (Q4) and 28 May (Q1)
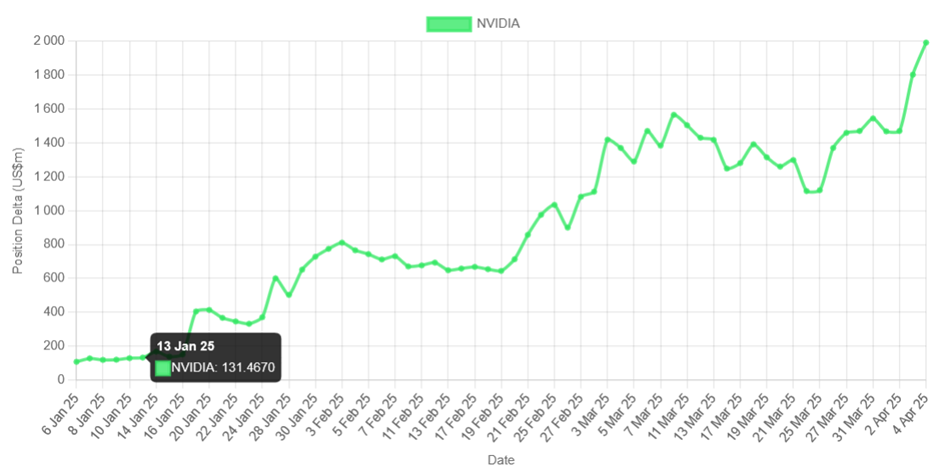
Source: SRP Greeks platform
The extended version of the graph (beyond 4 April) shows a drop in Nvidia’s Position Delta while the stock closed at 114.33 on 9 April 2025 (visible on the right-hand side of the graph)
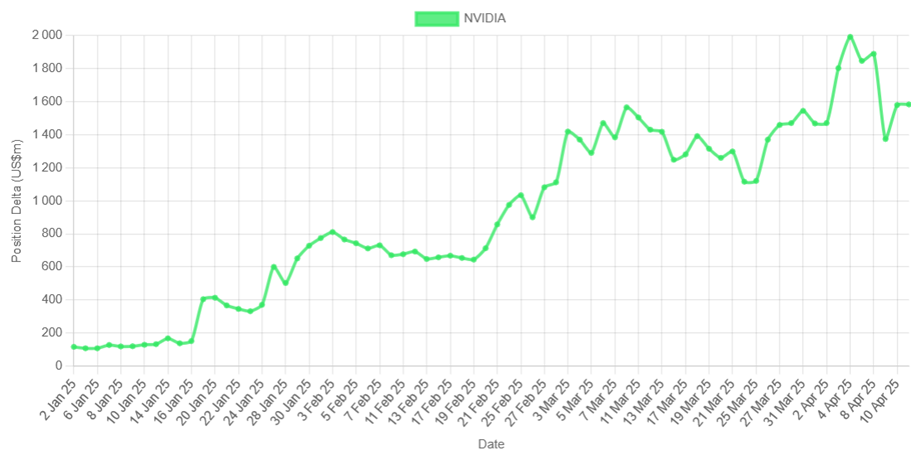
Source: SRP Greeks platform
In the next article, we will focus on the less common Greeks, such as Vanna and Charm, which are also integral to Structured Products Risk Business Intelligence (RBI).
These Greeks provide deeper insights into risk dynamics, revealing complexities that go beyond the more widely understood measures. As a result, there is more to the Greeks than often meets the eye.
Image: Maximusdn/Adobe Stock
| This article is based on data and analysis provided by the SRP Greeks product. Find out more about SRP Greeks here |
Disclaimer
- This content is not intended as a solicitation or an offer; it is provided solely for informational purposes to professional investors
- The information presented herein has been prepared with great care; however, errors may still occur