How fat tails, volatility surfaces and exotic payoffs reshape option pricing
This article takes a deeper look at future volatility and therefore complements our second article Volatility: neutralising Vega.
Volatility is neither constant nor known in advance
Because volatility is neither constant nor known in advance, we need an adapted framework to apply it to the various options embedded in structured products. Before we dive in, let’s take a brief historical detour.
After the “Black Monday” crash in 1987
It’s worth recalling, in a first step, a pivotal event that transformed how options are priced: Monday, 19 October 1987. On that day, known as “Black Monday”, the S&P 500 plunged by about 20.5% in a single session: the largest one‑day percentage drop in its history.
The crash made it clear that the probability of a severe equity market drop is much higher than what a normal (Gaussian) distribution of returns would predict. In other words, equity return distributions are left‑skewed and fat‑tailed - large, rapid crashes are rare, but not so rare that standard risk‑neutral pricing models with a single, constant volatility parameter can ignore them.
In the aftermath, (especially deep Out-of-The-Money) options became significantly more expensive, a shift visible in much higher implied volatilities. Specifically, implied volatility spiked sharply, and this increase was most pronounced for out‑of‑the‑money puts, which become in‑the‑money if the underlying asset falls sharply. But there’s more to volatility than that…
Beyond Black-Scholes: adjusting for volatility
When pricing options, future volatility estimates typically begin with At-The-Money (ATM) Forward volatility, anchored in the expected future spot price at expiration. In calibration, the typical practice leans on exchange traded options (as exchange traded derivatives), especially for short-term maturities where liquidity is highest and implied volatility data is most reliable - including diverse strike prices.
Unlike the single volatility assumption in the standard Black-Scholes model, options demand in practice a more detailed volatility surface. This surface is effectively a 3D framework for modeling volatility dimensions, moving to a structured grid of strike- and term-dependent values.
Into the realm of exotic options
Exotic options, such as barriers, introduce significant complexities that necessitate further refinement of the volatility surface. Consider, for example, the Barrier Reverse Convertibles (BRCs)’ short down-and-in put option, which is "knocked-in" when the underlying asset price hits a predetermined barrier level. It can exhibit markedly non-standard hedging behavior near the barrier: delta may change abruptly, especially as spot approaches the barrier and time to maturity shortens, as we saw in a previous article.
Moreover, pricing them robustly generally requires more than a static vanilla volatility surface: practitioners must specify how implied volatility evolves with spot and time and must account for key barrier features such as gap risk.
Ideally, a forward-looking volatility framework for equity structured products - often with longer tenors (like a 3-year reverse convertible) - captures not only plausible volatility dynamics (such as mean-reverting variance) but also the possibility of large jumps driven by broad market moves, sector shocks or idiosyncratic events. In such settings, where volatility dynamics and discontinuities significantly impact barrier option values, Monte Carlo simulation is often a natural and flexible pricing approach.
The analysis will focus on Roche as the BRC underlying.
The option’s parameters on 14 November 2025 are – the option is embedded in the BRC with the Stock price (end of day): 286.10 CHF, Strike: CHF222.10, Barrier: CHF177.68, Expiration: 1.42 year, Risk-free: 0% (estimated), Volatility: 22.50% (estimated). Dividend yield: 3.10% (estimated / accounted for).
The table below shows the option volatility and the Greeks for one share at different volatility modifications – all else remaining the same: our own valuations. The forward is at CHF273.81.
| Instrument (about) | Volatility | Value | Delta | Gamma | Vega |
| Short down-and-in put | 22.5 | 5.8788 | 0.1483 | -0.0034 | -0.902 |
| Short down-and-in put | 29.25 (= +30% versus 22.50) | 12.5767 | 0.2047 | -0.0031 | -1.0486 |
| Short down-and-in put | 36.00 (= +60% versus 22.50) | 19.8005 | 0.2321 | -0.0026 | -1.0827 |
| Short down-and-in put | 40.50 (= +80% versus 22.50) | 24.6861 | 0.2417 | -0.0023 | -1.0873 |
| Short down-and-in put | 90.00 (= highest) | 76.8815 | 0.2233 | -0.001 | -0.9992 |
Source: Evolids Finance
The option is clearly Out-of-The-Money: the ATM volatility needs to be modified upwards to get the proper option value. The table highlights that a 30% rise in volatility more than doubles the option price - so pricing is highly sensitive. And because the 1.42-year horizon lacks a direct benchmark in the exchange traded derivatives (ETD) market, making this adjustment becomes considerably more complex.
At the end of the day, it is the market maker - typically the issuer of the structured product - that provides a non-independent bid-ask quotation, from which the bid-side valuation can be extracted. The investor will, in any case, only be able to transact at that single provider's pricing.
However, an independent valuation remains critical for reference purposes and for generating additional information - particularly the Greeks (which are less commonly disclosed by issuers).
What about the SRP Greeks platform?
The SRP Greeks platform that allows the user to explore the common and less common Greeks, is, as expected, using modified volatilities for the daily valuation of the structured products.
Source: SRP Greeks platform
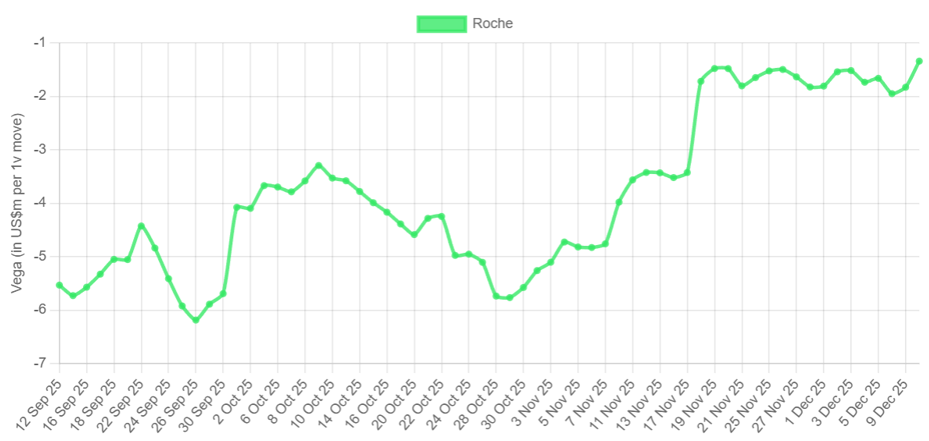
And here the Vega graph of all Roche-related structured products (being representative) that are considered for the SRP Greeks platform: within that period, Roche saw a sharp increase, so it makes sense that Vega risk has also declined. And since volatility shifts impact Vega, that's Vomma at work. (See the previous article on unusual Greeks).
In the next article, we will discuss “fugit”, a still-uncommon risk measure of Latin origin (despite often being mentioned alongside the Greeks), used in the context of structured products that may terminate early rather than at the stated maturity. This “time is flying” metric quantifies the product’s expected remaining life. It certainly deserves closer attention!
Image: David Santos Mendoza/Adobe Stock
| This article is based on data and analysis provided by the SRP Greeks product. Find out more about SRP Greeks here |
Disclaimer: This content is not intended as a solicitation or an offer; it is provided solely for informational purposes to professional investors. The information presented herein has been prepared with great care; however, errors may still occur