
The outperformance is most pronounced at lower observation frequencies.
A paper analysing the long-term performance of autocallable structured products found that a well-structured and diversified autocall strategy can be an attractive alternative to traditional investments.
This is the first time that research has been published on how the Market Stability Fund structures its portfolio - Jeroen Sinnige
According to the study, it is possible to exceed the stock market's risk-return ratio in the long run by exploiting inefficiencies in risk pricing, such as the volatility premium.
The research – written by Tobias van Steenis as part of his master thesis quantitative finance at the Erasmus University Rotterdam – compared the long-term performance of autocallables to that of a traditional equity investment in the underlying indices.
To enable this comparison, Van Steenis developed a methodology to construct synthetic return data for a portfolio of ‘worst-of’ autocallable products linked to a combination of five frequently used equity indices: Eurostoxx 50, S&P 500, Russell 2000, Nikkei 225 and FTSE 100.
MSF data
The dataset for the research was provided by the Market Stability Fund (MSF), which constructs the portfolio of their fund around OTC autocallable products.
It contained the 342 products that MSF has traded between January 2018 and April 2024 and included the trade and maturity date, the annual coupon rate, the payment barriers (knock-in barrier, coupon barriers and autocall barriers) of each autocallable as well as the underlying basket of the product.
“This is the first time that research has been published on how the Market Stability Fund structures its portfolio,” Jeroen Sinnige (pictured), managing director, portfolio management & sales at MSF told SRP.
“The study specifically confirmed our own observation that implied volatility is higher than realized […] it shows that weak years on the equity markets like 2022 are relatively ‘very’ favourable for this strategy and therefore also for the Market Stability Fund.”
The paper's findings are in line with MSFs own expectations and confirm a commitment to continuing its strategy, particularly by using major international indices, according to Sinnige.
“Structures with a maximum term of 12 months remain our current preference,” he said.
Figure 1: comparison of the monthly price performance of the autocallable strategy with the equal-weighted portfolio of the underlying indices
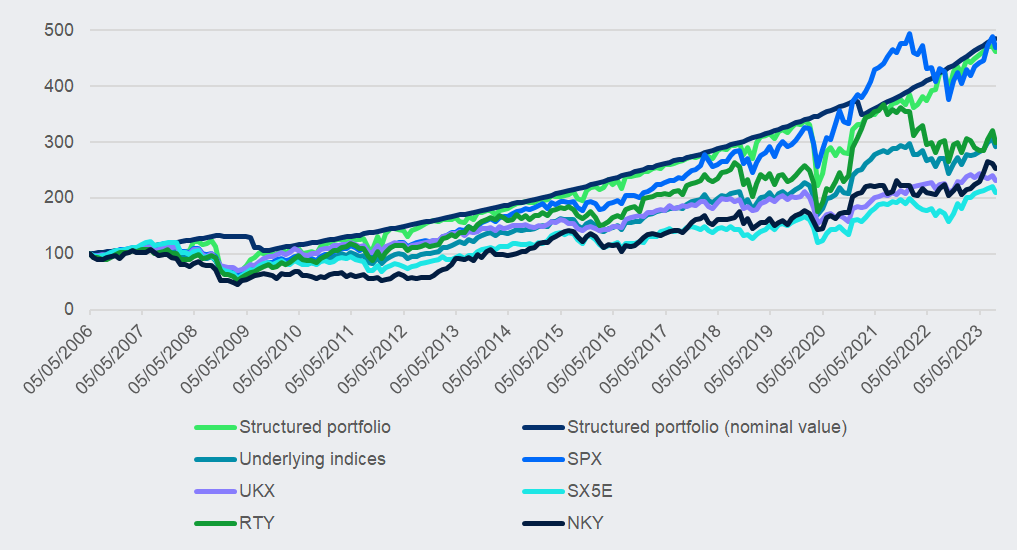
Source: MSF
Products included in the strategy featured a knock-in barrier set at 60%, a coupon barrier at 70% with monthly observations, and a stepdown autocall barrier which starts at 99% for the first month before decreasing by one percent per month. The products feature a memory coupon, and the maximum tenor is 12-months.
To estimate plausible coupon rates market variables were observed after which Monte Carlo simulations were deployed under a parsimonious multi-asset Heston model to price the products over their lifetime.
The resulting strategy, based on continuous reinvestment of autocallables upon product maturity, could then be compared to the equally weighted portfolio of the underlying indices.
‘The primary goal of the research was to provide investors with a clear understanding of the risk-return characteristics of an autocallable portfolio,’ van Steenis stated in his thesis.
‘Given the inherent complexity of these products, it is particularly important for investors to gain a realistic understanding of their performance and associated risks so they can make well-informed decisions,’ he added.
Figure 2: comparison real termination probability and model simulated termination probability
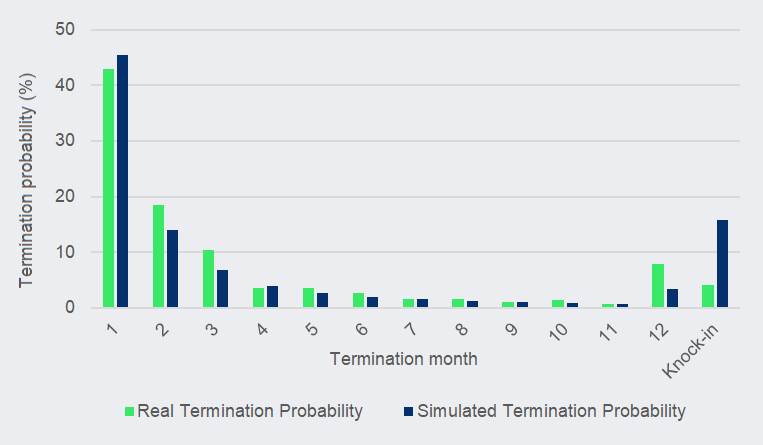
Source: MSF
According to the paper, the autocallable strategy consistently outperforms the benchmark on a risk-adjusted basis.
This outperformance is most pronounced at lower observation frequencies (i.e. monthly, quarterly and yearly), where the effect of short-term pricing deviations diminishes and the strategy more closely tracks the nominal value of the portfolio. At a weekly frequency, however, the standard deviation is higher due to the pricing model’s deviations from par at product initiation, leading to greater fluctuations in the portfolio value when reinvesting into new autocallables.
A key driver of the strategy’s outperformance is its ability to capture the volatility risk premium, reflected in the persistent gap between implied and realized volatility.
Because of the inflated implied volatility, the simulations from the pricing model overestimates the likelihood of knock-in events by a factor of nearly four. Thus, one receives a high coupon rate based on this overestimated tail risk, while the actual risk is considerably lower.
Moreover, Van Steenis argues that the early redemption feature of autocallables allows this volatility premium to be harvested more efficiently than in traditional volatility- selling strategies.
Table 1: return and risk across different observation periods for the autocall strategy and the individual equity indices
| Benchmark comparison | Individual indices | |||||||
| Time Frame | Metric | Autocallables (Portfolio Value) | Equal Weights | SPX | UKX | SX5E | RUT | NKY |
| Weekly | Sharpe ratio | 0.303 | 0.266 | 0.4 | 0.184 | 0.151 | 0.2 | 0.23 |
| Annualized return | 7.93 | 4.98 | 7.38 | 3.32 | 3.34 | 4.79 | 5.06 | |
| Standard deviation | 26.18 | 18.7 | 18.45 | 18.04 | 22.07 | 23.95 | 22.01 | |
| Monthly | Sharpe ratio | 0.372 | 0.302 | 0.446 | 0.23 | 0.179 | 0.222 | 0.248 |
| Annualized return | 7.95 | 4.99 | 7.39 | 3.32 | 3.35 | 4.79 | 5.07 | |
| Standard deviation | 21.38 | 16.54 | 16.57 | 14.48 | 18.74 | 21.55 | 20.48 | |
| Quarterly | Sharpe ratio | 0.367 | 0.282 | 0.426 | 0.216 | 0.17 | 0.209 | 0.252 |
| Annualized return | 7.94 | 4.97 | 7.36 | 3.3 | 3.33 | 4.76 | 5.08 | |
| Standard deviation | 21.65 | 17.63 | 17.27 | 15.23 | 19.6 | 22.78 | 20.17 | |
| Yearly | Sharpe ratio | 0.466 | 0.262 | 0.365 | 0.202 | 0.159 | 0.228 | 0.236 |
| Annualized return | 7.87 | 4.89 | 7.26 | 3.22 | 3.27 | 4.67 | 5.08 | |
| Standard deviation | 16.89 | 18.64 | 19.91 | 15.9 | 20.52 | 20.51 | 21.57 | |
Source: MSF
Click the link to read: Thesis: long-term performance analysis of autocallable structured products