
Worst-of-stocks and single stocks are favoured by Asian investors driven by the tech sector.
Equities remained the most favoured asset class for structured products sold in Asia ex-China in 2025, with a market share based on estimated sales volumes reaching 68% in the region, SRP data shows.
Worst-of-stocks structures accounted for the largest share at 36%, driven by sales in Hong Kong SAR and Taiwan.
Asia ex-China: asset classes’ market share based on estimated sales volumes in 2025
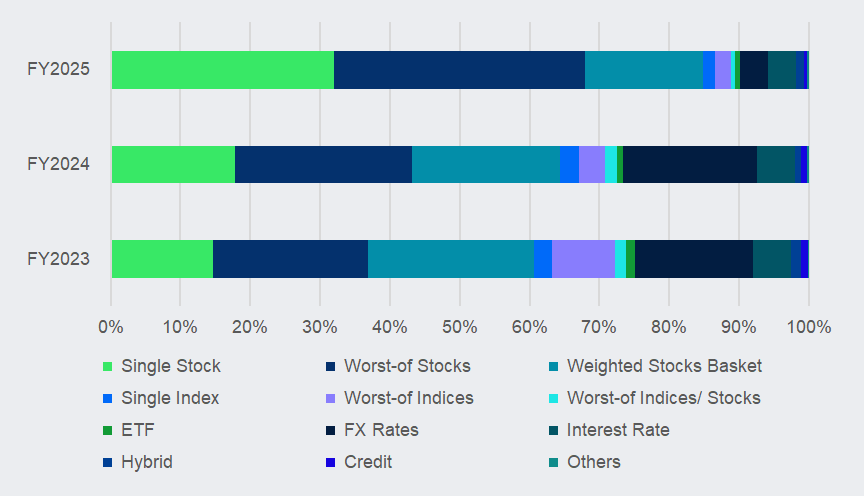
Source: SRP
Sales momentum in Hong Kong SAR last year was buoyed by equity-linked investments (ELIs), a type of public offering product sold on exchange. The net notional outstanding balance of the city’s ELIs rose over 55% from the start of the year to roughly HK$63.9 billion (US$8.17 billion) by the end of December, according to data from the Securities and Futures Commission.
The SRP database registered over 25,000 ELI issuances, structured with a worst-of stock payoff last year.
Taiwan’s structured notes also predominantly focused on the worst-of snowball payoff, which saw over 29,000 issuances in 2025. Most of these were focused on tech and semiconductor underlying exposures.
Single stock structures followed closely, taking up around 32% of the regional market share. Most of these volumes came from products sold in Hong Kong’s ELIs, which recorded over 28,000 single stock issuances in 2025.
The market share of the weighted stocks baskets stood at around 17%, which all came from Taiwan’s structured notes sales.
Single index and worst-of-index structures each amounted two percent of the regional market share. The latter was most commonly seen in South Korea, which recorded sales of US$11.3 billion in 2025. The Korean market also gathered US$3.3 billion from worst-of index and stock structures from last year.
Meanwhile, sales volumes of FX- and interest rate-linked products marked four percent of the regional market share, respectively. The former was mostly boosted by FX rate-linked structured deposits sold to Hong Kong’s retail investors, while the latter stemmed from Korea’s rate products that logged US$14.4 billion in volumes last year. Most of these Korean products were sold via the derivatives-linked bonds (DLB) wrapper as investors looked to lock in their positions for a higher yield in the rate-cut cycle. The three-month Korea Treasury Bond exposure was the top underlier for this category.
This trend was also observed in Thailand, with US$885m in rate-linked notes sold to the country’s high-net-worth investors last year.
Tech stocks lead the pack for single stock products
The artificial intelligence (AI) investment theme continued to fuel Asian investors’ interest in structured products. The tech underlying sector accounted for 43% of the regional structured products market in 2025 based on estimated regional sales, higher from 42% in 2024.
The tech sector’s market share has been above 40% for the past three years.
This is led by Nvidia, the most-traded asset across sectors, with 20% of the single stock products’ total volumes tracking the US chipmaker stock. Products linked to Samsung Electronics also accounted for 10% of the total sales of single-stock products last year.
Asia ex-China: single stock underlying sector's market share based on estimated sales volume in 2025
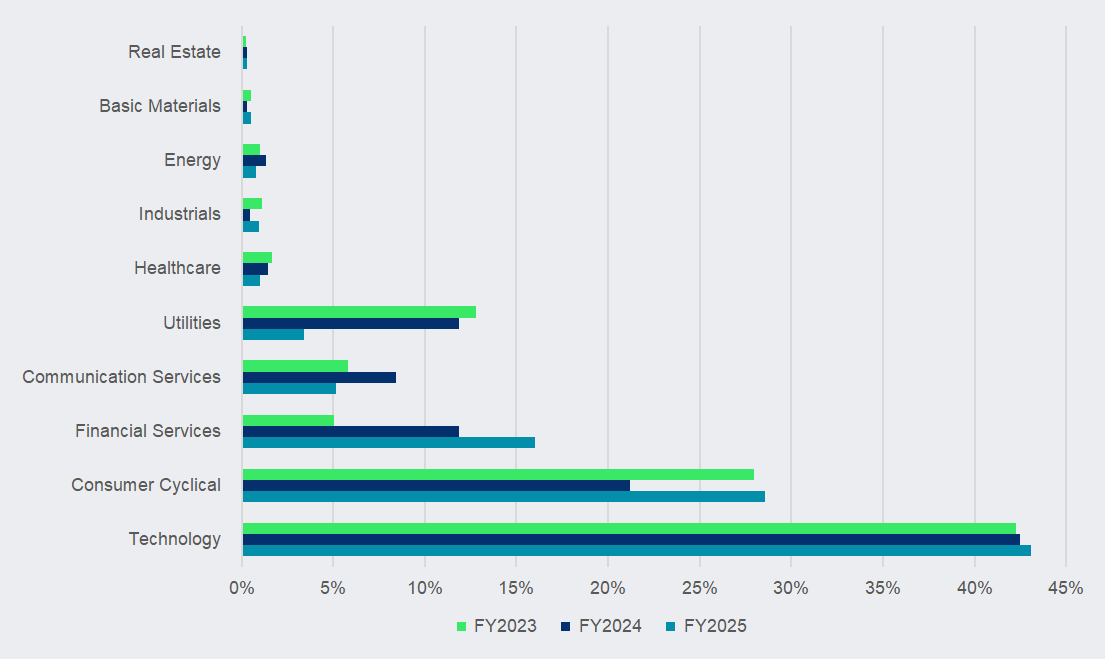
Source: SRP
The consumer cyclical sector was next in line, advancing to 29% of the market share from 21% in the prior year. Alibaba (H Shares), which falls under this sector, saw its market share reach 13% across single-stock-line products, the second-largest underlying. Meituan-linked products also accounted for six percent of the market share.
The financial services sector, with a 16% of the market share, was mainly led by shares of Hong Kong Exchanges and Clearing and HSBC (H Shares).
Additionally, the communication services and utilities sectors hovered at around five and three percent, respectively.
Image: Whyframeshot/Adobe Stock
Do you have a confidential story, tip or comment you’d like to share? Contact Us | SRP (structuredretailproducts.com)
Disclaimer: While SRP's aim is to provide accurate and up-to-date information, the data provided is gathered from third parties. SRP does not take responsibility for the accuracy of the data and will not be held liable for any errors or omissions contained in the information provided. The information and data included on SRP's market reports uses sources believed to be reliable. SRP assumes no liability or responsibility for the quality, content, accuracy or completeness of the information, text, graphics, links and any other items contained in this report.