
In his latest article, Patrick Oberhaensli analysis the risk and rewards for a barrier reverse convertible (BRC) linked to Stellantis.
Stellantis announced a massive charge of €22.2 billion (US$24.2 billion) in relation to its change of strategy (highlighting strategic risk: the risk of inadequate strategy) – away from the all-Electric Vehicles (for which it had over-estimated the demand) to a more balanced approach incorporating traditional engines and hybrid technology.
Consequently, the company eliminated its dividend and confirmed losses for 2025. This announcement triggered a significant share price decline of approximately 25% (based on closing prices) on 6 February 2026, as illustrated in the graph below.
STLAM.MI – price chart & technicals
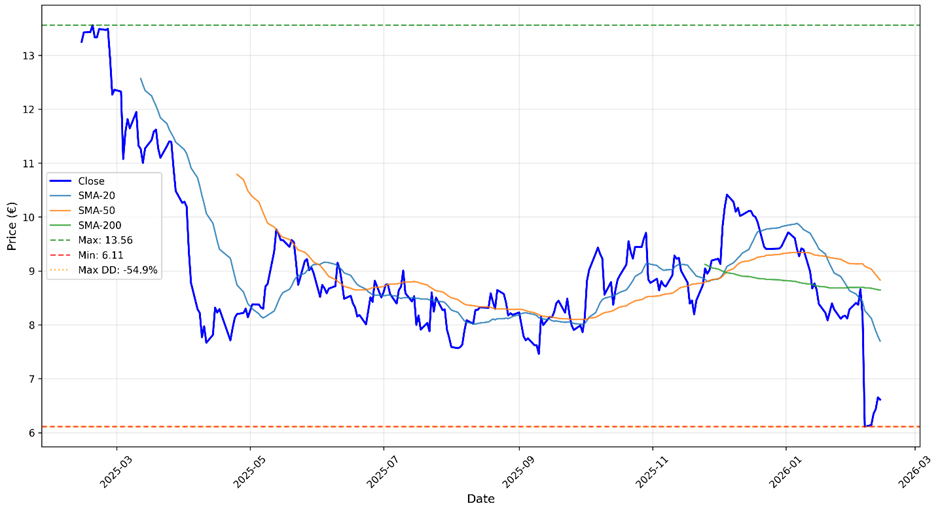
Source: Yahoo Finance, adaptation by EVOLIDS
The analysis will therefore focus on Stellantis as the Terminal Barrier Reverse Convertible underlying which has an annual coupon of 12.6%, where the barrier is only observed at maturity—meaning that despite sharp interim declines in Stellantis shares, the product was not triggered before the final observation date.
The option’s parameters embedded in the terminal BRC on 13 February 2026 are:
| Stock price (end of day): | € 6,613 |
| Strike: | € 8,286 |
| Terminal barrier: | € 62,145 |
| Expiration: | 0.96-year |
| Risk-free: | 2.37% (estimated) and |
| Volatility: | 50% (estimated) |
| Dividend (yield): | 0% (estimated/accounted for) |
| How many shares per €1,000 (notional)?: | 8.286 * 120.685494 (also a given parameter) = 1,000 |
The table below shows the option values and the Greeks for one share at different volatility levels – all else remaining the same: our own valuations. The forward is at €6.7652.
The structured product incorporates terminal short down-and-in put, where the barrier is only observed at maturity (as opposed to continuous or discrete monitoring).
| Instrument | Volatility | Value | Delta | Gamma | Vega |
| Terminal short down-and-in put | 50 | 2.0467 | 0.58659 | -0.144938 | -0.030424 |
| Terminal short down-and-in put | 40 | 1.7349 | 0.651572 | -0.190976 | -0.032071 |
| Terminal short down-and-in put | 55 | 2.1973 | 0.559958 | -0.129185 | -0.029829 |
Source: Evolids
To be compared with a short down-and-in put – with constant observation - for which the barrier of €6.2145 has been hit on 6 February, 2026 (with a low on that day of €5.73 for the stock). The short down-and-in put effectively became a short plain-vanilla put (once the barrier was breached).
| Instrument | Volatility | Value | Delta | Gamma | Vega |
| Short down-and-in put | 50 | 2.2841 | 0.56709 | -0.1214 | -0.02548 |
| Short down-and-in put | 40 | 2.0333 | 0.626061 | -0.14618 | -0.02455 |
| Short down-and-in put | 55 | 2.4121 | 0.542544 | -0.11131 | -0.0257 |
Source: Evolids
We observe that the terminal short down-and-in put is valued lower, which is logical as it offers investors the advantage of a single barrier observation (compared to continuous monitoring) at the product's termination.
For both options, the Vega will fluctuate with changes in implied volatility, as illustrated in the examples. However, the magnitude of this variation is relatively modest.
For the terminal short down-and-in put, if the volatility jumps from 50 to 55% then the Vega (measured) impact is a loss of 5 × (-0.030424) = -0.1521 which compares with the option price change of (2.0467– 2.1973) = -0.1506 – pretty comparable. That is a loss of about 7.36%.
While Vega alone may not be significant, a volatility spike often accompanies sharp declines in the underlying, making the Delta effect predominant. Consider a 20% drop in the underlying from €8: for a terminal short down-and-in put with 40% volatility, this represents a loss of -1.60 × 0.651572 (Delta) = -€1.0425.
Returning to the terminal BRC valuation as of 13 February, 2026, we observe the following with an assumed volatility of 50% (and some rounding done):
| Present Value of the principal: | € 977.50 |
| Present Value of the coupon: | € 123.17 |
| Total bond component: | € 1,100.67 |
| Terminal short down-and-in put value: | € 2.05 |
| Total short 121 terminal down-and-in puts (strike 8.29, barrier €6.21) position: | -€ 247.01 |
| Makes for the 1’000 notional: 1,100.67 – 247.01 = | €853.66 or a price of the Terminal BRC of 85.37% |
| With a volatility of 40%, we get: | 89.13% |
In conclusion, the terminal BRC offers a lower coupon than a BRC with continuous barrier monitoring, reflecting its reduced risk profile. In the specific case we examined, while the barrier has been hit, the product still has nearly a year until maturity - providing an opportunity for recovery.
The critical question remains: will the underlying recover above the barrier by expiration?
Should this occur, investors would receive 100% of principal (plus the coupon). Otherwise, the downside exposure remains.
In our next article, we'll return to our regular series, continuing with the theme of interest rates and their associated Greek risk measure, Rho.
Image: Stellantis
| This article is based on data and analysis provided by the SRP Greeks product. Find out more about SRP Greeks here |
Disclaimer: This content is not intended as a solicitation or an offer; it is provided solely for informational purposes to professional investors. The information presented herein has been prepared with great care; however, errors may still occur.