
We look at yield enhancement and capital protection product issuances and market share in Hong Kong SAR, South Korea, and Taiwan in the first quarter of the year using SRP data.
Hong Kong SAR
Equity-linked yield enhancement strategies lead Hong Kong’s publicly distributed structured products market in Q1 26, accounting for 98% of estimated sales volume in the first quarter of the year, according to SRP data.
This ratio represnets a 64% increase from last year’s same period.
Hong Kong SAR: product groups' market share based on estimated sales volumes
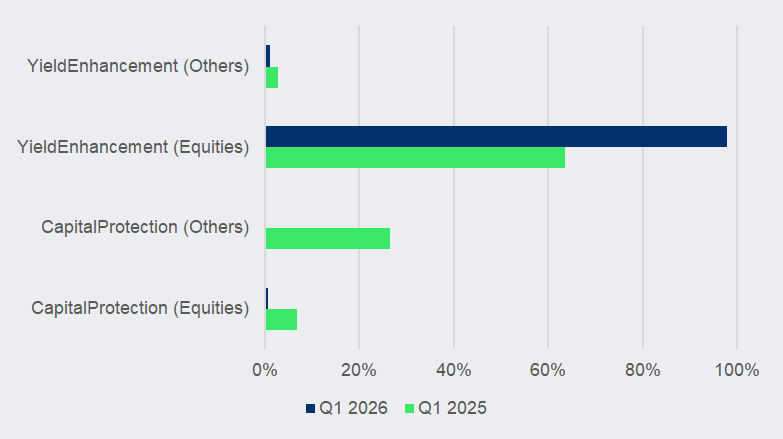
Source: SRP
The latest figure come on the back of over 17,000 issuances during the quarter, with the majority wrapped as equity-linked investments (ELIs), a retail-focused product popular among retail investors in the city.
These ELIs are roughly evenly split between single-stock and worst-of-basket-of-stocks structures. Nvidia and Alibaba (H Shares) led as the most-used underlyingsfor single stock ELIs, recording 2,854 and 1,786 issuances, respectively – they are structured as either autocallable reverse convertibles or autocallable barrier reverse convertibles.
These two equity stocks are also the most popular assets for worst-of basket structures, alongside HSBC (H Shares), Micron Technology and Meituan.
Capital-protected products accounted for just one percent of publicly distributed sales volumes in the city from January to March, down from seven percent a year earlier.
Over 6,000 issuances were seen during the period, mostly structured deposits offering exposure to the FX market, with the AUD/USD pair leading the pack recording over 2,300 products in Q1 26.
A further one percent of market share came from 204 yield enhancement products on other asset classes including 109 hybrid products, 89 exchange-traded fund (ETFs)-linked products and six real estate-linked products – all wrapped as ELIs.
South Korea
Sales volumes of yield enhancement products rose 15% year-on-year to US$4.07 billion in South Korea from January to March.
Despite higher volumes, the market share of yield enhancement products slipped to 30% from 32% a year ago. This comprises 28% of equity-linked products and two percent of other asset classes, such as interest rates.
South Korea: product groups' market share based on sales volumes
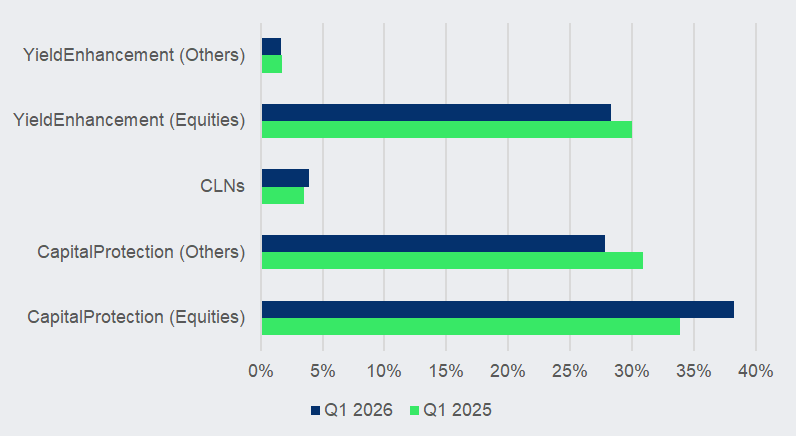
Source: SRP
Most of these yield enhancement products were wrapped as equity-linked securities (ELS), also known as capital-at-risk autocallable notes.
Over 57% of the yield enhancement products’ volumes, or US$2.34 billion, came from products linked to baskets of benchmark indices led by the S&P 500, Kospi 200 and Eurostoxx 50, commonly with a worst-of payoff. Baskets of stocks ranked second, recording US$937m in sales during the quarter, or 23% of the yield enhancement total volumes.
Capital protection products saw stronger growth in Korea, with volumes rising 24% year-on-year to US$8.97 billion in Q1 2026, lifting its market share to 66%, from 65% a year earlier.
Among, the market share of equity-linked capital protected structures made up 38%, up from 34% in the prior year’s period - mostly equity-linked bonds (ELBs), which often feature a digital payoff, as well as the emerging fully-principal-protected autocallable payoff.
The market share of capital protection on other classes’ dropped to 28% in Q1 26 from 31% a year ago. Interest rates were the most-used asset class in this category, led by the three-month Korea Treasury Bond, which saw sales volumes hover at around US$3.07 billion. These products were often packaged as derivatives-linked bonds (DLBs), with the majority traded via private placement.
Meanwhile, around US$505.7m in credit-linked notes (CLNs) were sold in the quarter, up 34% year-on-year. This product is wrapped in derivatives-linked securities (DLS). SK Hynix was the most-sold reference entity for CLN’s underlying, with volumes near US$194m.
Taiwan
Yield enhancement products dominated Taiwan’s structured notes market, with a market share of 95% based on estimated sales volumes in Q1 2026. This remains unchanged from the same period of last year.
The market share of equity yield enhancement notes stood at around 93% mostly driven by structures linked tobasket of stocks, with Nvidia and Taiwan Semiconductor Manufacturing Company as the most-used shares, excluding unspecified underlyings, as local wealthy investors seek to tap into higher yields from such products linked to volatile stocks.
The number of equity-linked yield enhancement issuances went up by 80% year-on-year to some 19,500 products.
Taiwan: product groups' market share based on estimated sales volumes
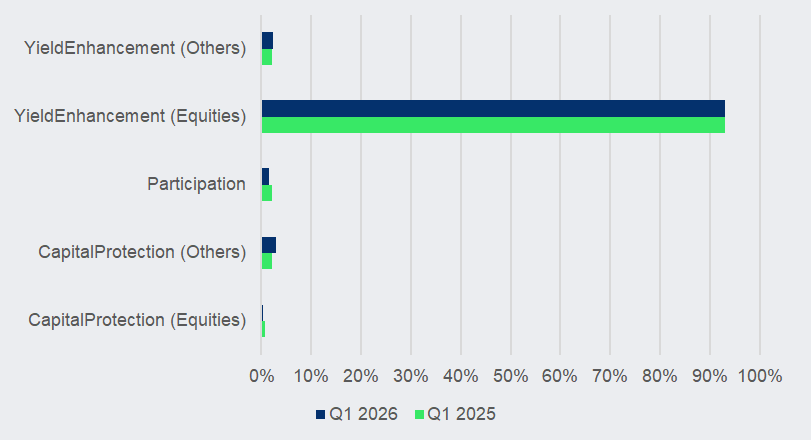
Source: SRP
In the yield enhancement category, other asset classes accounted for two percent of the market share by estimated sales. This came on the back of around 480 product issuances, doubling year on year.
Capital protected products made up around three percent of the total market share of the local structured notes market based on estimated sales, with most of these coming from interest rates-linked products led by the 10-year USD Constant Maturity Swap Rate, excluding unspecified assets.
There was also one percent from participation products, or bonus enhancement notes, down from two percent a year ago. The number of issuances was up 20% to 297 products during the quarter – most of these are a basket of stock structures.
Image: Leungchopan/Adobe Stock
Do you have a confidential story, tip or comment you’d like to share? Contact Us | SRP (structuredretailproducts.com)
Disclaimer: While SRP's aim is to provide accurate and up-to-date information, the data provided is gathered from third parties. SRP does not take responsibility for the accuracy of the data and will not be held liable for any errors or omissions contained in the information provided. The information and data included on SRP's market reports uses sources believed to be reliable. SRP assumes no liability or responsibility for the quality, content, accuracy or completeness of the information, text, graphics, links and any other items contained on this report.