
Tracking the evolution of key Greeks across nine major indices shows how directional and volatility risk built through the first quarter of 2026 before moderating, while remaining heavily concentrated in a handful of benchmark exposures.
In previous Greeks articles we have focused on the current Greeks exposures for a set of underlyings and the significance of those levels. In this article and the charts shown the emphasis is on the change over time of a set of key Greeks and major indices.
The main point from the charts is that, while the portfolio is linked to a broad set of indices, the risk is not evenly spread
The charts show the evolution of Delta, Position Delta and Vega over a six-month period. The indices examined are the S&P 500, Eurostoxx 50, Russell 2000, DJ Industrial Average, Nasdaq 100, FTSE 100, Nikkei 225, Kospi 200 and Hang Seng China Enterprises Index.
The main point from the charts is that, while the portfolio is linked to a broad set of indices, the risk is not evenly spread.
The S&P 500 is the dominant exposure across the period, particularly in position delta and Vega. Eurostoxx 50 and Russell 2000 are also meaningful contributors, while the remaining indices are much smaller in aggregate terms. This is to be expected given the composition of structured products markets by underlyings. This distinction is important because it highlights how a portfolio can appear diversified by underlying count but still have its actual risk profile driven by a relatively small number of large notional exposures.
The delta chart shows a clear build-up in directional sensitivity through the first quarter of 2026, followed by a reduction during April and May. S&P 500 delta rose from around 3.9 at the start of January to a peak of about 5.8 at the end of March, before falling back to around 3.7 by the end of May. The Russell 2000 Index followed a similar pattern, rising from around 3.8 to a peak close to 5.7 before ending the period below 3.0. The Eurostoxx 50 index also rose through March, although from a lower starting point, before easing in the final part of the period.
Figure 1: delta indices
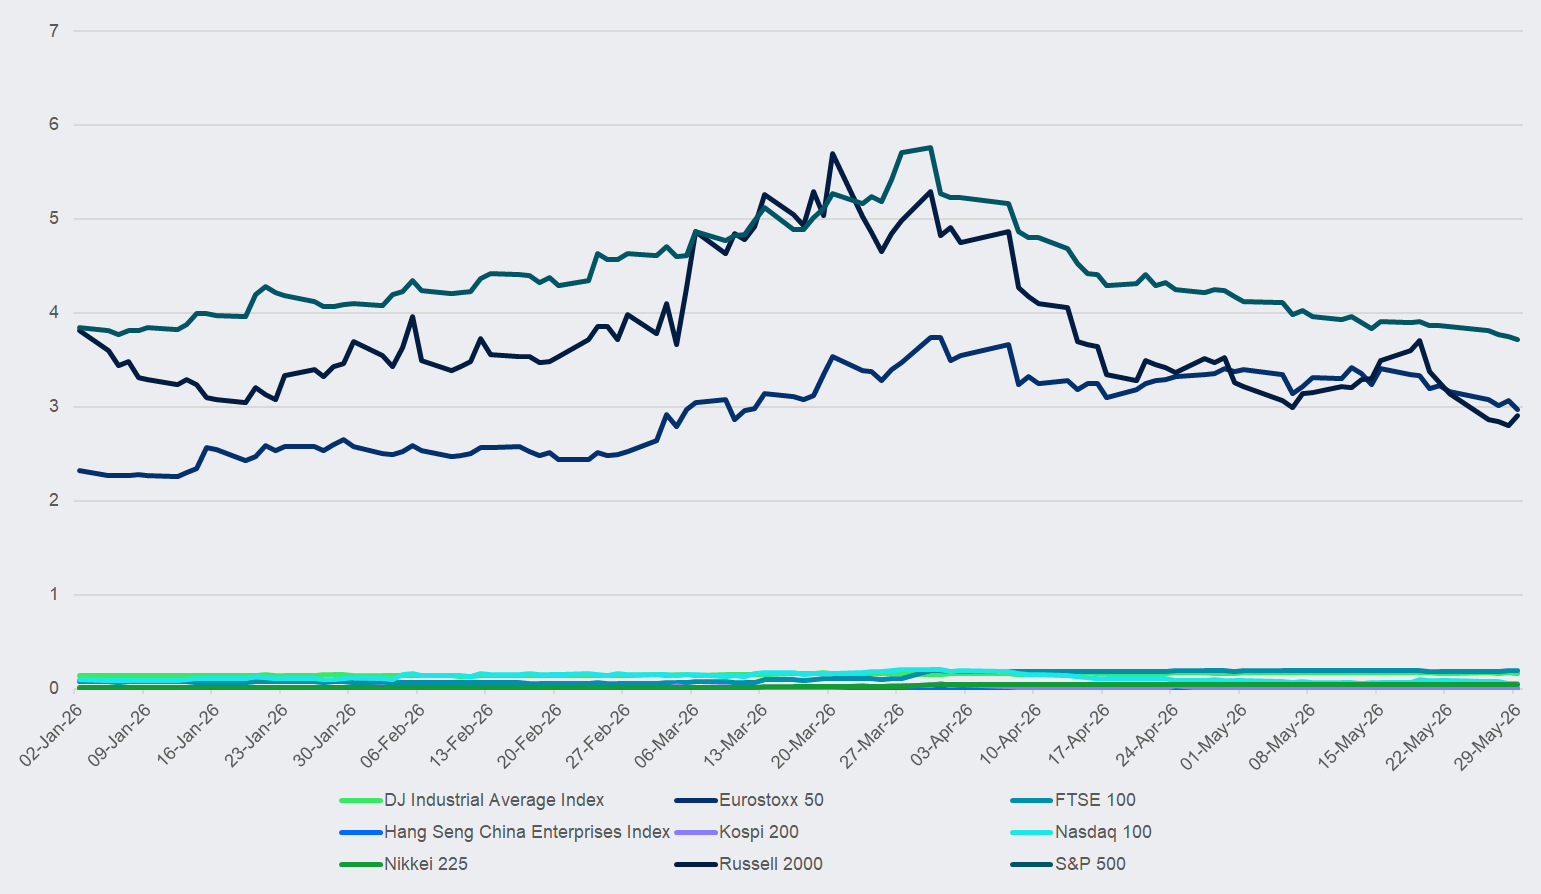
Source: LSEG/FVC
This suggests that the portfolio became more directionally sensitive during the first quarter, particularly to US equity indices, before that exposure then reduced. Over a shorter horizon the chart also shows that delta over the past month was a period of relative stability rather than increased risk levels. During May S&P 500 delta drifted slightly lower while Eurostoxx 50 ended the month lower, and Russell 2000 fell back after a short-lived increase around the middle of the month.
The position delta charts tell the same story in more direct portfolio terms. S&P 500 position delta rose from around 26,400 at the start of January to more than 36,000 in late March, before declining to just over 28,000 by the end of May. Eurostoxx 50 position delta increased from roughly 13,600 to above 20,000, ending May around 18,000. Russell 2000 peaked at just under 14,000 before falling back to around 8,500.
Figure 2: position delta indices
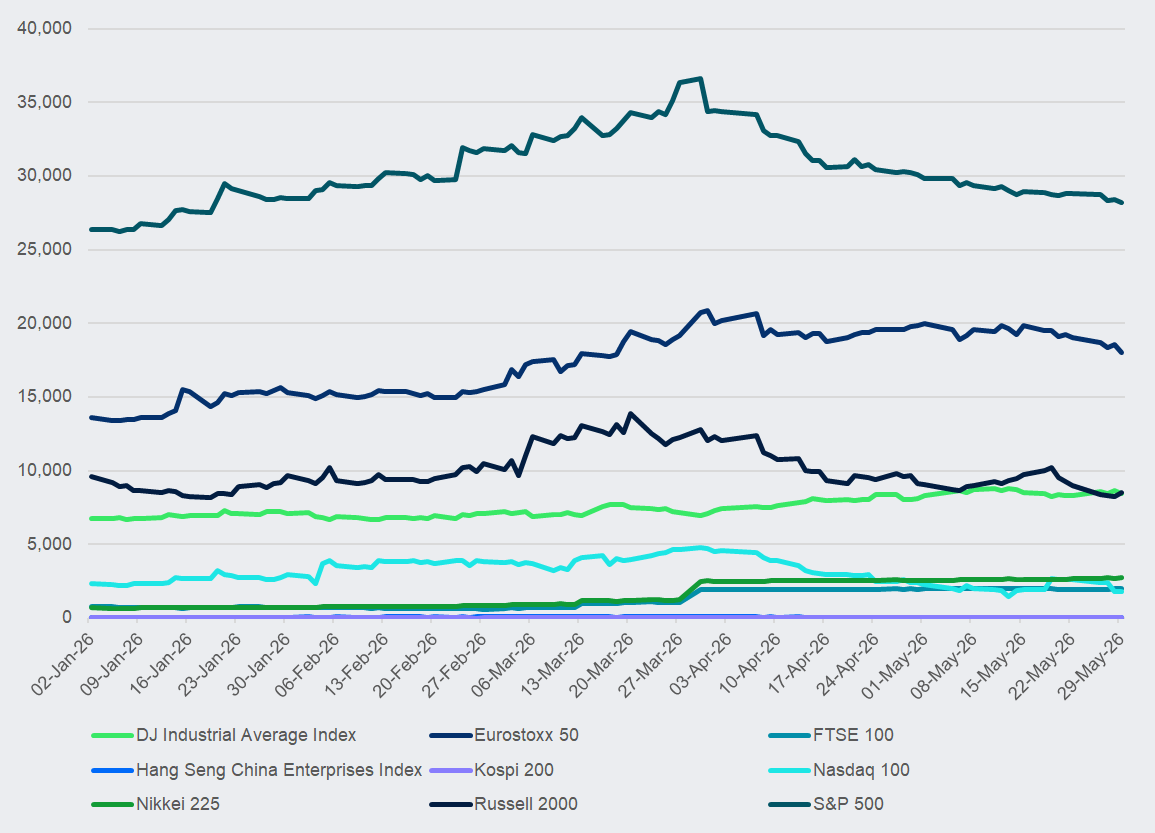
Source: LSEG/FVC
The scale of these numbers reinforces the concentration point. S&P 500 is by far the largest contributor to overall directional exposure. Eurostoxx 50 is the second largest and notable as by far the most significant non-US index, while the Russell 2000 is also relevant, particularly during the period of increased sensitivity in March. The other indices add breadth to the portfolio, but they do not materially affect the overall sensitivities.
The Vega charts show a similar pattern to the delta charts, although in the opposite direction. As directional exposure increased into March, the portfolio’s Vega became more negative, most notably for the S&P 500, Russell 2000 and Eurostoxx 50. For a structured products portfolio negative Vega is typical since most products are capital at risk. Many structured products have short-volatility exposures, depending on product type, barrier levels, coupon structure and remaining term.
Figure 3: Vega indices
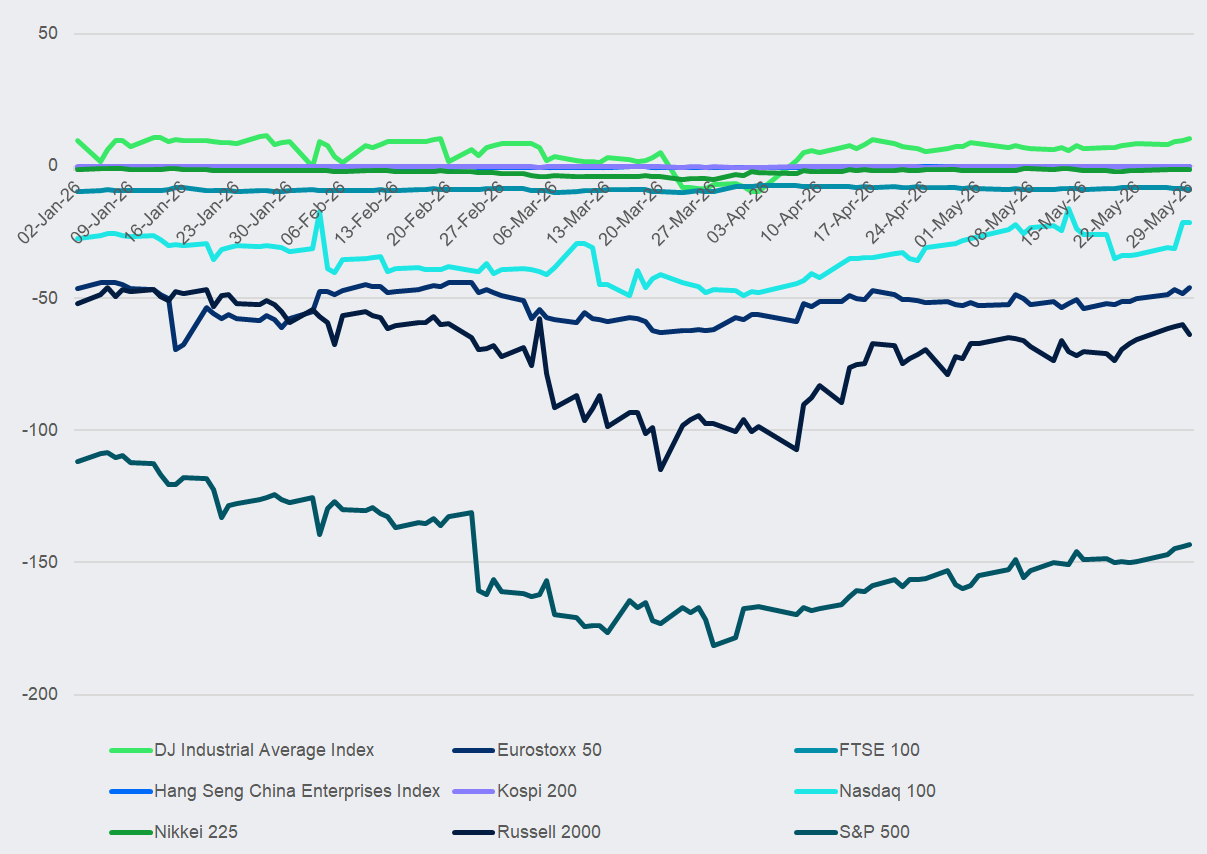
Source: LSEG/FVC
By the end of May, Vega had moved back from its most negative levels, broadly in line with the reduction seen in delta and position delta. S&P 500 Vega remained the largest exposure, but it had improved from its late-March low. Russell 2000 and Eurostoxx 50 also showed lower Vega magnitude by month end. In terms of Vega the month of May was relatively stable, with only modest changes across the main indices.
The conclusion is therefore not that volatility risk behaved differently from directional risk, but that both measures point to the same broad portfolio story. Risk increased into March and then moderated during April and May. However, even after this reduction, the largest sensitivities remained concentrated in the same indices, particularly the S&P 500, Eurostoxx 50 and Russell 2000.
Overall, the charts show that based on the Greeks identified the portfolio’s main risk drivers are not the full list of selected indices, but a smaller group within it. The S&P 500 is the dominant exposure, Eurostoxx 50 provides the largest European contribution, and Russell 2000 is notable because its Vega is relatively large compared with its position delta. The other indices are present, but they appear secondary from an overall portfolio risk perspective.
This type of analysis is useful because it separates broad underlying exposure from actual risk contribution. A structured products portfolio can contain multiple indices and appear widely spread, but the Greeks show where the economic exposure sits. In this case, the selected index set confirms that the portfolio led by S&P 500 exposure, with Eurostoxx 50 and Russell 2000 forming the next most important areas of risk.
Image: Kateryna/Adobe Stock
| This article is based on data and analysis provided by the SRP Greeks product. Find out more about SRP Greeks here |
Disclaimer: This content is not intended as a solicitation or an offer; it is provided solely for informational purposes to professional investors. The information presented herein has been prepared with great care; however, errors may still occur.