
Using a bond interpolation method, our analysts draw some parallels between the performance of Treasury bonds and structured products.They also look at put and call options for two popular underlyings – Apple and the S&P 500, during the market crash of mid-March, comparing the February-April 2020 versus the same period in 2019.
In this analysis, we have computed implied volatility of several of the best-sold underliers of structured products. Our preliminary intention was to come up with figures indicative of their implied volatility for all the months comprising Feb-April 2019 and Feb-April 2020.
The methodology selected overlaps with the implied volatility calculation method stipulated in the methodology of the CBOE S&P 500 Implied Correlation Index - namely, the Barone-Adesi Whaley option valuation model. We utilised several checkpoints depending on the expiry date of options following the stock of Apple and S&P 500, respectively.
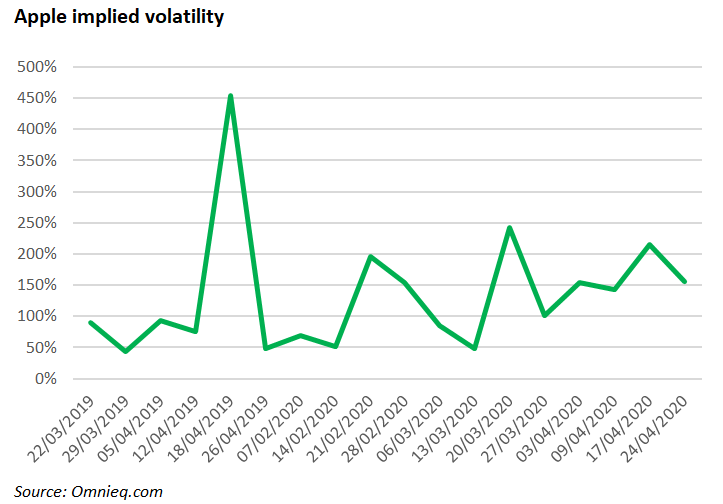
Our main finding is that the implied volatility of Apple options spiked the most on 18 April 2019. On average April 2019 had an implied volatility of 167.95% compared to 167.1% in April 2020. Other months had considerably lower volatility. Conversely, the peak in implied volatility of the S&P 500 was recorded on 20 March 2020, at 208.69%.
Apple Case Study
Option open interest – the power to predict bullish/bearish continuation or reversal patterns
In order to interpret the meaning open interest conveys for the Apple stock, we collated the respective peaks and troughs of the open interest options amount. As per theoretical definitions, the open interest of an option represents the number of outstanding existing contracts for a particular stock and is a reliable indicator for secondary market liquidity - in other words, the open interest is the difference between option positions opened and closed outstanding on a certain date. In general, rising open interest represents more money coming into the market, whereas falls in open interest are representative of money outflows.
While open interest tends to be strongly indicative of liquidity, its function per se cannot guarantee that option traders had an adequately informed view of forthcoming stock price movements, and its capacity to create sound bullish or bearish forecasts is muddled, unless we juxtapose the open interest figures to the prevailing closing stock prices on their corresponding dates.
Basic options trading understanding postulates that during periods of upward trends in underlying stock prices, a rising open interest may predict a continuation of the upward trend. On the contrary, an increase in the open interest occurring concurrently with a downturn in stock prices, can prolong the price declines.
Deceleration of open interest following a sustained upward or downward price move of the underlying stock may signal a fading trend. The climax in open interest as of 18 April 2019 coincided with an upward price momentum from the Apple stock from 12 April 2019 to 23 April 2019, and as supported by options theory, price uptrends occurring in congruence with an increasing open interest may be construed as a bullish sentiment, as the increase in open interest has been primarily accounted for by long option positions.
We can obtain a more nuanced view of the impact of the interplay between options open interest and stock prices by construing 2020 data, characterised by a much greater volatility of the observed closing stock prices.
From 9 March 2020 until 23 March 2020, the Apple stock price went through a visible decline, while the outstanding call option open interest stood at 504,359 currently open contracts (369,049 open put contracts) as open interest underwent a hefty upsurge compared to previous expiration dates. It is worth pointing out the call open interest summit was far more pronounced than the put peak.
Such a scenario of stock downtrend complemented by a hike in options open interest signifies that new money is flowing into the market on the short side, consistent with bearish perceptions among investors. To delve even further into our argument, short positions became the pinnacle of option traders' strategies around 23 March 2020, particularly for call option holders, indicating a propensity for short-selling.
Apple’s put call ratio – comfortably below 1.00 except for February 2020
Investment signals are also famously gleaned from the put-call ratio, yet conclusive evidence about its figures can only be established adequately contingent on individual investors' investment philosophy.
A contrarian investor will surely opt for a long-position when the put-call ratio exceeds 1. Contrarian investors are more vested into a company's financial fundamentals and espouse a longer-term investment outlook. Momentum investors, on the other hand, will opt for a selloff when the put-call ratio is above 1, and a strong purchase intention is best substantiated by a put-call ratio of below 0.5-0.7 (depending on individual risk appetite).
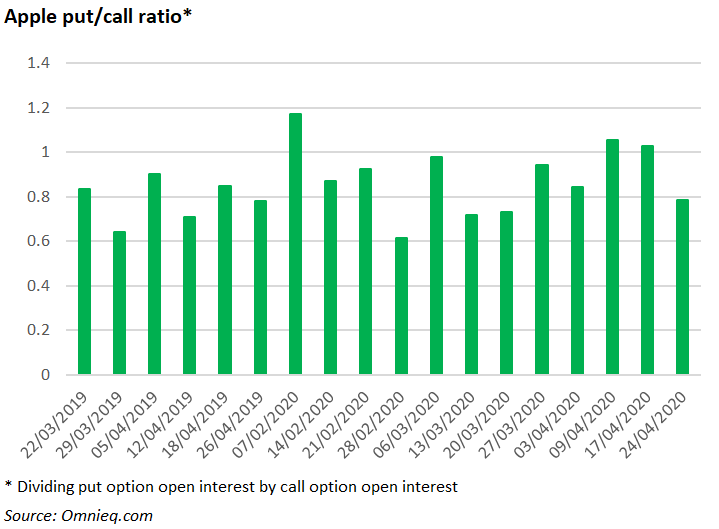
A put-call ratio below 0.7 (or 0.5) is supports the argument (at least in the mindset of momentum investors) that the investment sentiment strongly indicated towards bullish. Securities with a put-call ratio between 0.7 and 1 are deemed to be trading in a sideways market. The greatest average monthly put-call ratio was observed in April 2020 and stood at 0.92, indicating Apple's stock is moving in a sideways manner, and stock dips are relatively bearable in an environment etched by profound uncertainty.
Being a cyclical stock, demand for Apple products did fall. The perilously high put-call ratio of 1.17 at the beginning of February 2020 occurred due to the supply chain tensions in China, where the pandemic erupted prior to spreading to the US. Strong first quarter 2020 figures were recorded for the services branch of Apple (Apple Music, App Store, cloud services), while iPad and iPhone sales stagnated moderately, counteracted by a rise in the relatively niche wearables product line and the introduction of a low-cost iPhone SE. Apple's decision to boost its buyback programme from US$75 billion to US$100 billion certainly smoothed some of the effects of uncertainty around the Apple stock.
The Option Greeks influence on Apple – delta and gamma fell during the pandemic, vega signalling a spike in implied volatility
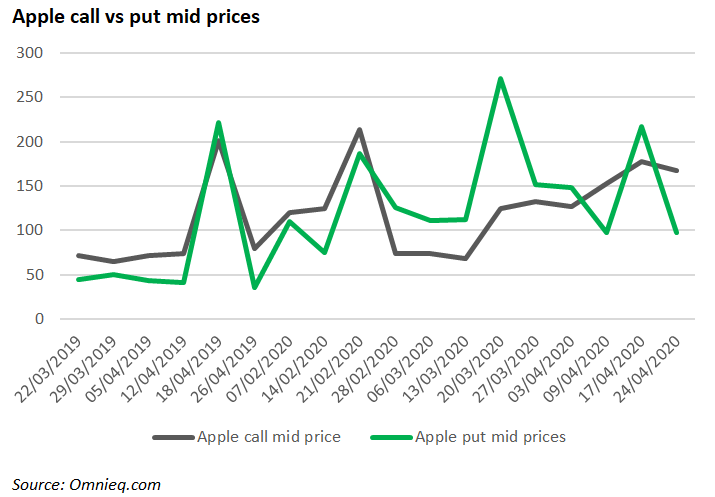
A greater propensity for long call options in March 2020 to fall out of the money was observed in March 2020 when a delta-neutral hedge position could be achieved by 3.05 long call positions to cover a single short call position. Logically negative delta for put options was higher in at-the-money (ATM) options in March 2020 standing at -67.07%. Simply put, the higher the delta for call options, the higher the likelihood of falling into the in-the-money (ITM) territory upon maturity, as in March 2020 the probability of a long call position to benefit from stock price rises above the strike price was 32.83%, whereas long put option holders had a 67.07% probability to avail of stock price declines.
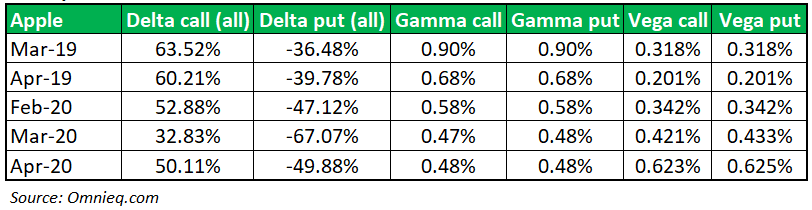
Gamma measures the rate of change of delta against the underlying asset stock price - it is the strength of probability delta remains in the ITM territory (>0.5) or out-of-the-money (OTM) territory (<0.5). Gamma is lowest for deep ITM and deep OTM options, and highest for those options near the money. A high gamma is tantamount to a higher risk since an unfavourable move in the underlying asset will have a disproportionately sizable impact on the option delta. Considering the rule of thumb that gamma is highest for ATM options and lowest for deep ITM or deep OTM options, we may stipulate that March and April 2020 were characterised by a greater number of option contracts being deep ITM or deep OTM.
Vega assesses option premium fluctuations induced by changes in the implied volatility of options. Call option sellers benefit from falls in implied volatility, whereas call buyers would embrace rises, as it will uplift underlying spot prices, and will therefore maximise the opportunity to gain intrinsic value in excess of the strike price. The higher vega in 2020 reflects greater volatility.
How did Apple sales pan out at the structured product forefront?
Overall, structured products tracking Apple experienced exponential growth. In number terms, for the period February-April 2019 products whose payoff is contingent upon Apple (and perhaps additional underliers as a part of a worst of option payoff) accumulated a sales volume of approximately US$131m. A year later, the equivalent quarter saw Apple products flourish to US$448.29m.
In February 2019, the best-sold payoff was the knock out, worst of option (US$11.342m. USD), in March 2020 the knock out, reverse convertible (US$20.52m), in April 2019 the knock out, reverse convertible, worst of option (US$56.84m), in February and March 2020, the knock out, reverse convertible, worst of option, (US$66.39m), and in April 2020 the knock out, reverse convertible (US$48.72m).
S&P 500 Case Study
Open interest surged in a period of plummeting prices – short-selling in March 2020. Bear market rally in April 2020.
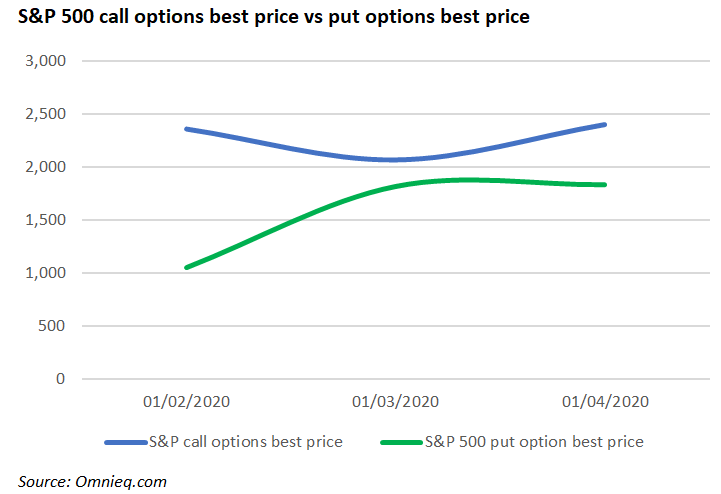
Between 21 February 2020 - 20 March 2020, the S&P 500's value plunged by 30.94%, while the number of open interest option contracts soared by 222.8% for call contracts, and 229.22% for puts. This dichotomy may stem from the fact that a great number of traders bet against the market, and option contracts were entered into onto the short side. The S&P 500 gained 24.71% between 20 March 2020 and 17 April 2020. Simultaneously, open interest decreased by 76.05% for calls and 47.5% for puts. What do we make out of this? The signal is that money is leaving the option market, as the S&P 500 rebound has been perceived, at least by some analysts, as a bear rally.
Some believe that a V-shaped recovery of the economy is feasible while a majority reckon a W-shaped recovery is the more likely outcome, at least until a vaccine against the Covid-19 virus is available. The put-call ratio was computed to be ominously high on all three checkpoints (February 2020 - 2.51; March 2020 - 1.38; April 2020 - 1.61) so momentum investors may still eschew entering long call positions.
The probability of reaping profits from long positions in call options was subdued in March 2020, yet long put positions thrived. The situation normalised upon an option reading on 17 April 2020 when call options tracking the S&P 500 had a 63.46% probability of ending up ITM.
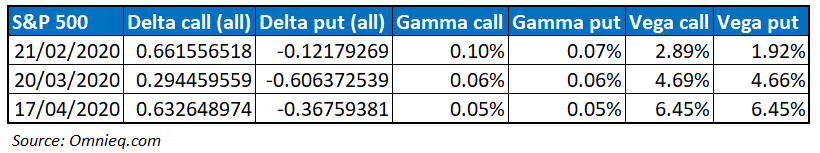
Exceptionally low Gamma of S&P 500 revealed a greater probability of options to expire deep ITM or deep OTM
Gamma for the S&P 500 was uncharacteristically low, compared to the computations for gamma of the other popular structured product underlying analysed - Apple.
As stated, low gamma is typical of deep ITM and deep OTM options. Thus, we computed to what extent OTM puts exceeded, ITM put were below, OTM calls were below, ITM calls exceeded - the option strike price. It was quite clear that the margin was sizeable: for all four aforementioned option types in March 2020, and for ITM calls and OUT puts in April 2020. The latter observation may be rationalised by the rise of S&P 500 in April 2020.