
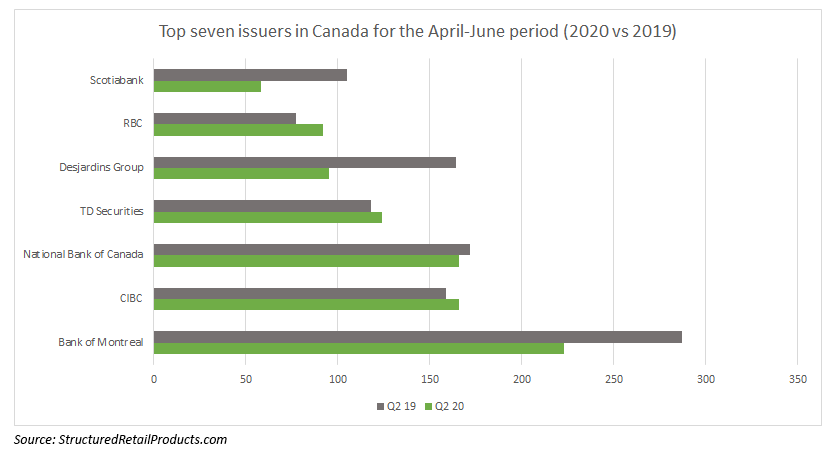
Canada’s leading providers Bank of Montreal and the Royal Bank of Canada have seen their structured product issuance tumble in Q2 from the first quarter of 2020, SRP data shows.
Nevertheless, Bank of Montreal (BMO) continues to dominate the Canadian structured products market having issued 223 products in Q2 20, compared with its Q1 20 and Q2 19 figures of 326 and 287, respectively. CIBC and National Bank of Canada stand in second and third place with issuance of 166 products each.
Royal Bank of Canada (RBC) has been less prolific but managed to boost issuances by a small margin with 92 structured products in Q2 20, compared with 89 in Q1 20 and 77 in Q2 19.
BMO has a total of 3,168 live products, according to the SRP database. The tranche investments are wrapped as PPNs, notes, and GICs while underlyings are dominated by stocks of banking firms including the Canadian Imperial Bank of Commerce, Bank of Nova Scotia, Royal Bank of Canada, Toronto Dominion Bank, and National Bank of Canada.
The products differ in maturity length and prominent asset classes include equity (single index, share basket, index basket), hybrid, fund, credit, interest rate and commodities.
RBC has 27 live products listed as institutional tranche investments of varying maturities. The products are wrapped as warrants as well as notes and are tied to 17 underlyings, some of which include the S&P500, Eurostoxx 50, 2Y USD Constant Maturity Swap Rate and 30Y USD Constant Maturity Swap Rate.
Asset classes include interest rate, fund, and equity (single share, single index, and index basket).
BMO
Adhering to an alternative schedule, both BMO and RBC have reported their third quarter earnings for the period of April to June 2020.
BMO reported slides in net income of CAD$1.2 billion in Q3 20, compared with its Q3 19 figure of CAD$1.56 billion and drops in adjusted net income amounting to CAD$1.26 billion from CAD$1.58 billion.
Provision for credit losses stand at CAD$1.1 billion, an increase from CAD$309m in the same period of 2019, while total revenues have crept up to CAD$7.2 billion from CAD$6.7 billion in Q3 19.
The bank’s US division also suffered a blow in its earnings with CAD$263m in Q3 20 from CAD$368m in the same period of 2019.
The bank headed by chief executive officer Darryl White (pictured) reported an increase of 36% in reported net income for the quarter (CAD$426m) for its capital markets business. Adjusted net income stands at CAD$435m representing an increase of CAD$116m from Q3 19.
The bank’s CET1 ratio elevated from 11.0% to 11.6% as a result of retained earnings growth, lower source currency risk-weighted assets (RWAs), and other net positive impacts.
RBC
RBC’s reported net income has taken a small hit of 2% year-over-year totalling CAD$3.2 billion, while diluted earnings per share (EPS) have decreased by 1% to value CAD$2.30.
Wealth Management saw net income plummets of 12% from Q3 19 valuing CAD$562m while compared to the previous quarter, net income actually increased by 33%. This was primarily from the reversal of unfavourable changes in the fair value of interest rate derivatives, seed capital investments, and the net impact of the bank’s US share-based compensation plans.
Capital Markets reported a significant increase in net income, both from Q3 19 and the previous quarter of 45% CAD$296m and CAD$844m, respectively. This was driven by higher fixed income trading revenue across all regions.
The bank notes higher equity trading revenues in the US market, reflecting more desirable market conditions and increased client engagement.