
Morgan Stanley and JP Morgan’s sales and issuance figures have increased and fallen respectively during the third quarter of 2020 compared to the same period a year ago.
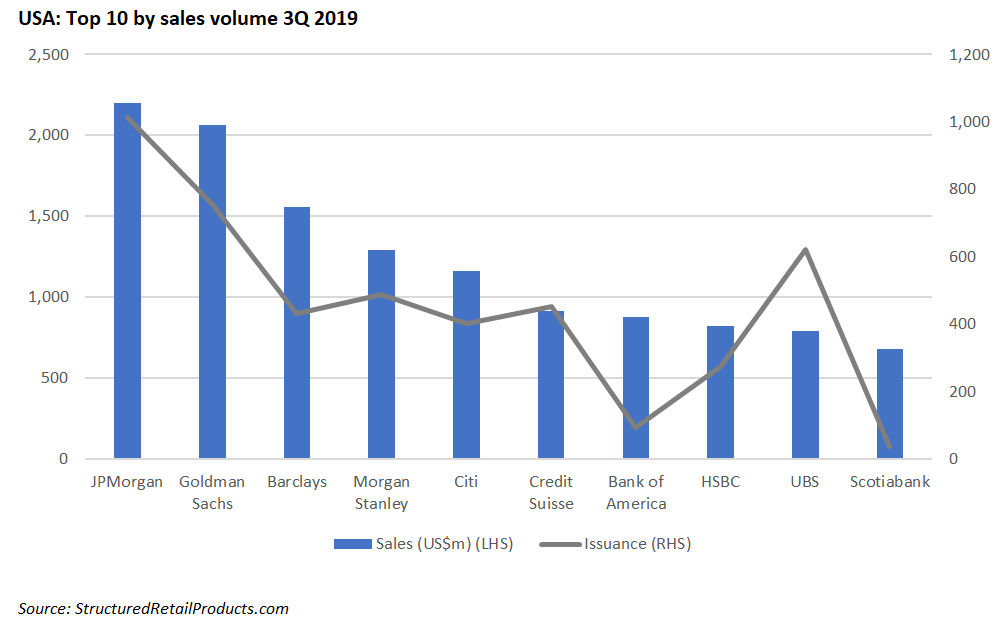
Morgan Stanley issued a total of 541 structured products for US$1.55 billion in Q3 20, a considerable boost from its Q3 19 figure of 489 products at a sales volume of US$1.29 billion, according to SRP data. Despite the increase in issuance and sales, the US bank lost two positions in the top seven US issuers ranking.
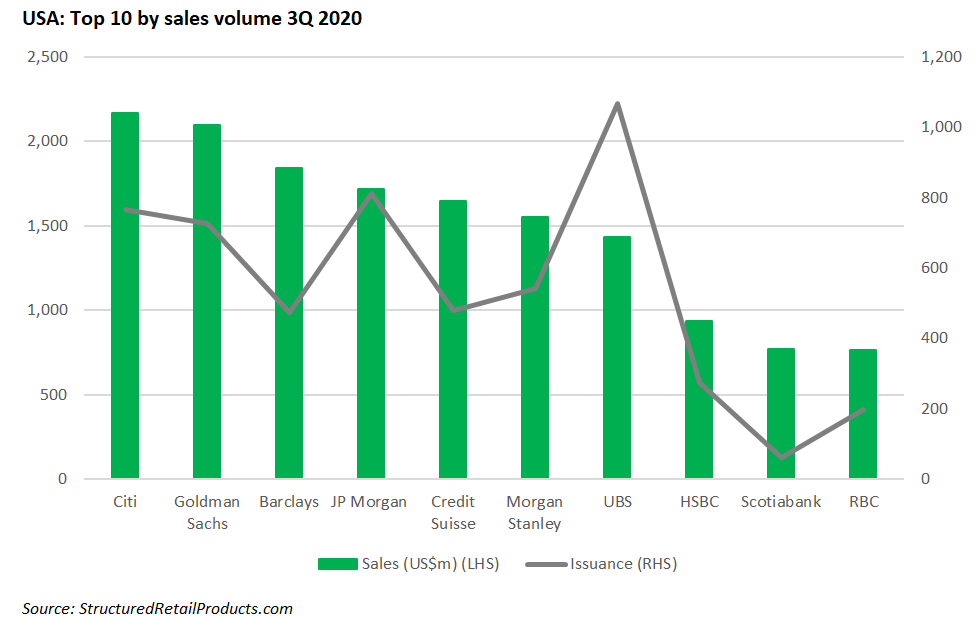
JP Morgan has lost some ground from its position as the most prolific issuer group in Q3 2019 with 1,013 products at US$2.2 billion, after issuing 812 products in Q3 2020 at a volume of US$1.72 billion. At the end of Q3 2020, JP Morgan was fourth in terms of market share among the top 10 issuers in the US market behind Citi (767 products/US$2.2 billion), Goldman Sachs (726/US$2.01 billion) and Barclays (474/US$1.84 billion).
Morgan Stanley boasted a 25% rise in net income of US$2.7 billion in the third quarter, compared with its US$2.2 billion figure in the same quarter of last year. The bank also reported a 16% increase in net revenues totalling US$11.67 billion from US$10 billion in Q3 2019.
Sales and trading revenues also climbed by 20% year-on-year, an achievement that the bank attributes to a strong performance across products on continued client engagement.
Revenues from equities stood at US$2.26 billion from US$1.99 billion at the end of Q3 2019 while fixed income revenues total US$1.93 billion, an increase from its Q3 2019 figure of US$1.43 billion.
Total assets under management stood at US$715 billion, a rise from US$507 billion in the same period of 2019.
SRP data shows that Morgan Stanley as an issuer group has 5,590 structured products listed in the US database. Wrappers include registered unlisted notes (4,991/US$20.2 billion) CDs (592/US$754.3m), registered listed notes (two/US$81.22m) and warrants (three/US$1.06m).
Popular underlyings are the S&P500, Russell 2000, DJ Industrial Average Index, Eurostoxx 50, Nasdaq 100, and Morgan Stanley MAP Trend Index. The tranche investments fall under the 11 asset classes, some of which include equities (single index, index basket), hybrid, interest rate, and commodities.
JP Morgan reported a Q3 2020 net income of US$9.4 billion, a 101% growth from its Q2 2020 figure of US$4.7 billion and a four percent increase on its Q3 2019 value.
Net interest income was down nine percent at US$13.1 billion due to lower rates largely offset by higher net interest income in CIB markets and balance sheet growth.
Provision for credit losses was US$611m, a decrease from US$903m from the prior year while noninterest expense stands at US$16.9 billion, a three percent climb due to higher legal expense.
Risk-weighted assets total US$1.43 trillion as of 30 September 2020 and remains steady from its 2019 figure though represents a decrease from 30 June 2020 (US$1.45 trillion).
JP Morgan as an issuer group has 10,602 live products on SRP’s US database. Some wrappers include registered unlisted notes (6,547/US$16.7 billion), CDs (3,955/US$9.7 billion), and certificates (53/US$28.99m). Popular underlyings are the S&P500, Russell 2000, Eurostoxx 50, JP Morgan Efficiente Plus DDS 5 Index, and DJ Industrial Average Index.
The bank’s tranche issuance falls under various asset classes including hybrid, equities (single share, share basket, index basket, single index), commodities and interest rate.
Click to view the Morgan Stanley and JP Morgan Q3 20 earnings reports.
Image: Ivan Karpov/Unsplash.