
The US bank has increased its issuance of structured products in Q3 21 despite fall in market certificate of deposit sales.
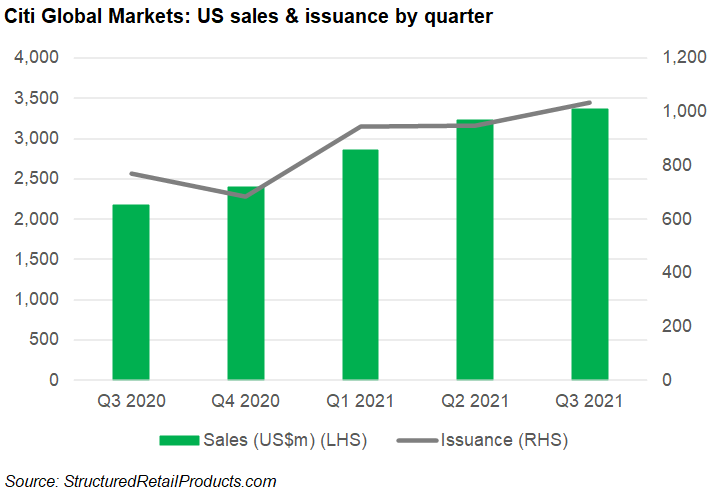
The new issuance rose from 771 to 1,033 in Q3 21 year-on-year (YoY), leading to a notional amount of US$3.36 billion, up 54.7% YoY, SRP data shows.
On a quarterly basis, the bank’s issuance increased by 8.7% while the sales notional was up four percent. Sales of structured deposits were testimonial with just four certificates of deposits launched at US$6.2m, a plunge from US$55.3m in Q2 21, according to the data.
By payoff, worst-of options, reverse convertible and callable remained the most popular having appeared on 658, 617 and 364 structured notes in Q3 21, respectively.
The bank also retrieved an old structure - a floating rate note, which makes coupon payments based on a reference rate, was issued in September. This payoff was last seen on a product issued by Citi in February 2019, according to SRP data.
The 12-year callable note on the 2Y USD constant maturity swap (CMS) rate and 30Y USD CMS rate was sold at US$0.91m offering full capital protection. It offers a fixed quarterly coupon of 4% pa for the first year and a coupon calculated as four times the difference between the two interest rate swaps for every quarter afterwards. Each coupon is subject to a maximum rate of 8% pa.
In the US market, Q3 21 saw additional six floating rate notes, some were also deployed with callable or steepener, which speculates on the shape of interest rate curve and makes profit if it steepens, SRP data shows. The issuers of these notes includeS Finance, BofA Finance and Scotiabank.
Additionally, the US bank launched a five-year note with a best-of option linked to an index basket and a non-specified fund basket, in August. The growth product with zero capital protection had a notional of US$1m.
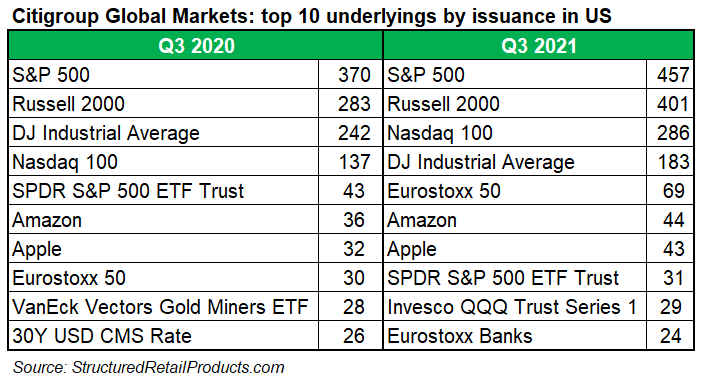
The Eurostoxx Banks Index, iShares MSCI Emerging Markets ETF and ARK Innovation ETF gained traction in Q3 21 compared with the prior-year period – these underlyings were linked to 24, 23 and 31 notes, respectively.
The Citi Dynamic Asset Selector 5 ER Index was linked to 22 notes with a notional of US$42m, which was higher than the US$35m YoY, or lower than the US$54m quarter-on-quarter (QoQ). As of October, the index-linked notes have collected US$751m through 491 products in US since early 2017, SRP data shows.
In Europe, the US bank issued 43 non-flow structured products across medium-term notes, pensions, and investment certificates, 40 of which were issued via the Citigroup Global Markets Funding Luxembourg entity. The increase in activity - an increase from 33 QoQ, or from 23 YoY, driven by the Italian market.
The FTSE Custom 100 Synthetic 3.5% Fixed Dividend Index was the most used underlying asset by the bank in Europe during this period – it featured on seven products worth US$16.8m, followed by shares of Unicredit and Delivery Hero, according to SRP data.
Earnings
The bank led by Jane Fraser (pictured) has reported a net income of US$4.6 billion for Q3 21, or US$2.15 per diluted share, on revenues of US$17.2 billion. This can be compared with a net income of US$3.1 billion, or US$1.36 per diluted share, on revenues of US$17.3 billion for Q3 20.
The net income of US$4.6 billion increased by 48% YoY driven by a lower cost of credit, partially offset by the lower revenues and higher expenses.
The revenues declined one percent YoY, including a pre-tax loss of approximately US$680m related to the sale of the Australia consumer business in global consumer banking (GCB). Excluding the loss on sale, revenues increased 3%, largely led by growth across the institutional clients group (ICG).
For ICG, the revenues rose four percent to US$10.8 billion YoY primarily driven by ‘higher revenues in investment banking, equity markets and securities services, partially offset by declines in fixed income markets and treasury and trade solutions’.
In the meantime, GCB revenues dropped 13% to US$6.3 billion on a reported basis and 14% in constant dollars YoY. On this basis and excluding the Australia loss on sale, revenues decreased five percent, as ‘continued solid deposit growth and momentum in investment management were more than offset by lower card balances and deposit spreads’.
The operating expenses increased five percent to US$11.5 billion in Q3 21 YoY.
Click here to view the Citigroup’s earnings presentation.