
Strategy indices have been an area of focus in the structured products market for quite some time although their significance has decreased over the last four years.
Between 2019 and 2022, sales volumes for structured products linked to strategy indices decreased by 46%. The highest sales were registered in 2019, when US$10.4 billion was invested in products tied to strategy indices. Fast forward to 2022, and we see that sales have almost halved, although year-on-year (YoY) volumes were only down by 4.5%.
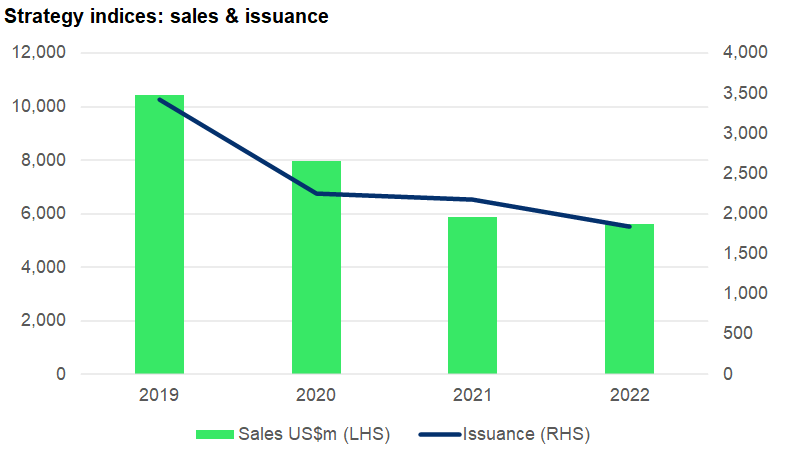
Issuance was also down 46% in the period 2019-2022 and like sales, the highest issuance, at 3,423 products, was recorded in 2019. In 2022, some 1,843 products were linked to strategy indices, a 15% fall YoY.
Europe, Middle East & Africa (Emea) registered the highest sales in 2019-2022, with US$3.6 billion linked to strategy indices in 2022 alone – up 11% YoY. The same year, US$1.8 billion was invested in the Americas, down 8.1% YoY, and a further US$150m was tied in products targeted at investors in Asia Pacific (-75% YoY).
Although the highest sales during 2019-2022 were seen in Emea, issuance levels in the period were much higher in the Americas, with 62% of all products linked to strategy indices issued in the region.
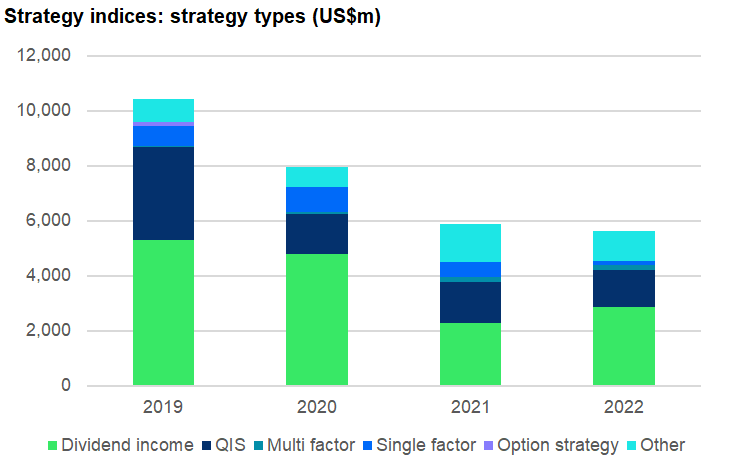
Dividend income strategies claimed a market share of 50% or more in each of the years under review – except for 2021, when it held 39%.
The other main strategy, QIS indices, captured 32% market share in 2019, but by 2022 their impact had somewhat decreased as they ended the year with 24% market share.
Multi-factor indices steadily increased their market share during the period, and although still relatively small, they reached 3.3% in 2022 with single-factor indices heading the other direction, going from a market share of 11.3% in 2020 to just 2.2% last year.
The ‘other’ category (20% market share in 2022) includes equity/bond/fund/commodity indices with a risk control strategy (target volatility overlay).
The SRP strategy/custom index report 2023 will be available soon.