
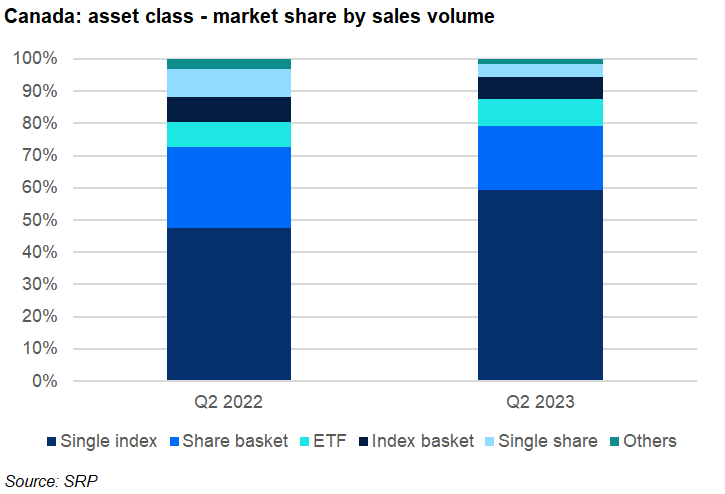
Products linked to single equity indices increased their market share by 11 percentage points YoY.
An estimated C$3.3 billion (US$2.5 billion) was collected from 1,131 structured products in the second quarter of 2023 – a 42% decrease by sales volume year-on-year (YoY).
Average sales, at C$2.9m per product, were also down compared to Q2 2022, when products sold on average C$3.3m.
Products linked to single equity indices increased their market share to 59% - up 11 percentage points YoY. In total, 736 such products were issued during the quarter (Q2 2022: 956), including 371 structures on the Solactive Canada Bank 40 AR Index that gathered sales of around C$950m.
The next index in line was the S&P 500, which, at C$135m, accumulated far less sales, although issuance (60 products) was also on a much smaller scale than for its Solactive counterpart. Other indices that sold well included the Solactive Canada Blue Chip AR Index (C$125m from 14 products) and the Solactive Canadian Large-Cap 100 AR Index (C$120m from 60 products).
The market share for products linked to a basket of stocks fell from 25% in Q2 2022 to 20% this quarter. It was achieved from 191 products that sold a combined C$650m. Shares of companies from the oil and gas sector most often frequented a basket, including those of Cenovus Energy (55 products), Suncor Energy (54), and Canadian Natural Resources (53).
ETF-linked products captured 8.4% of the market (Q2 2022: 7.7%) while product linked to an index basket held 6.8% (Q2 2022: 7.9%). The former achieved sales of C$275m from 103 products with the iShares Core S&P 500 ETF CAD Hedged, seen in 39 products, the preferred ETF for the Canadian investor, while the 60 products tied to an index basket sold C$225m.
The 28 products linked to a single share collected C$135m (Q2 2022: C$500m from 108 products) – the equivalent of a four percent market share (Q2 2022: 8.8%). Of these, the share of Bank of Nova Scotia (five products) was the most popular.