In the second of a three-part article, SRP analyses the performance of index-linked products in Europe during 2023.
In part one, which focused on equity-linked structured products in Europe, we mentioned a decrease in structured products linked to equity indices due to increased demand for products linked to stocks.
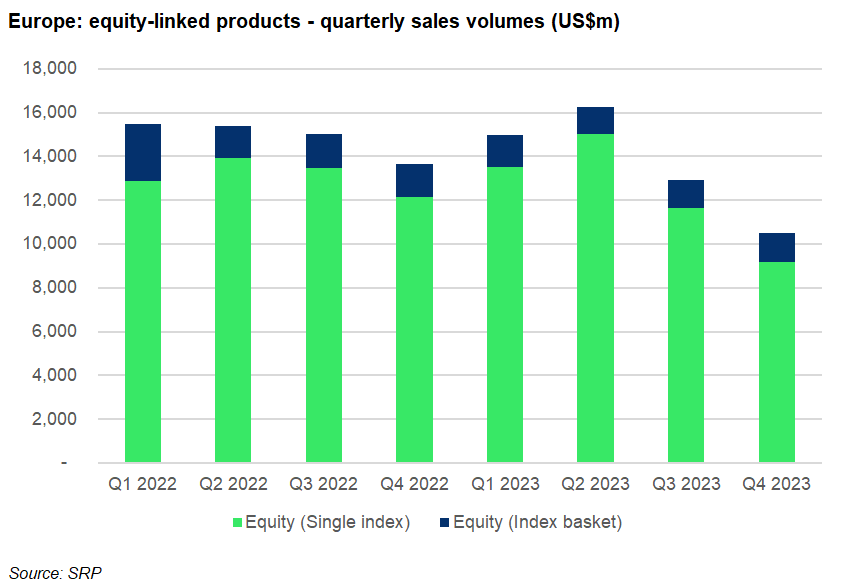
Sales of index-linked products reached US$55 billion in 2023 – down eight percent compared to 2022. The traded notional initially recorded a six percent year-on-year (YoY) growth in Q2 2023 but subsequently fell in Q3 (-14%) and especially in Q4 (-23%) compared to the same periods in 2022.
The more pronounced decrease in the sales volumes in the last quarter of the year could be attributed to the strong stock market performance at the end of 2023, which drove equities near peaks, waiting for the slightest opportunity to correct.
This is why investors have been turning to stocks of quality pulling back from less concentrated indices.
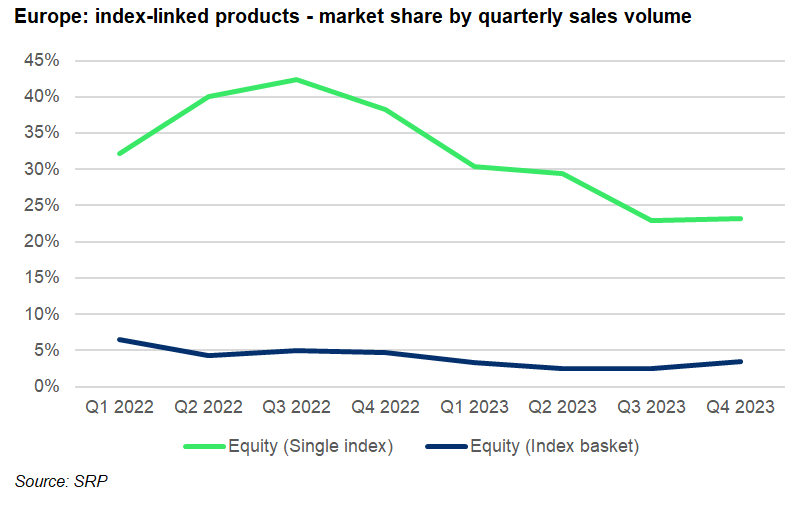
The market share of products linked to an index also fell from 42% of the offering in Q3 2022 to 23% as of Q3 2023. However, here the decrease has been driven by the demand for capital protected products linked to rates (12% of the overall traded notional in 2023 vs seven percent in 2022).
We have clearly seen a general diversification of the underlying asset class mix last year.
The market share of products linked to a multi-index basket decreased too, but managed to somewhat reverse the trend towards the end of 2023.
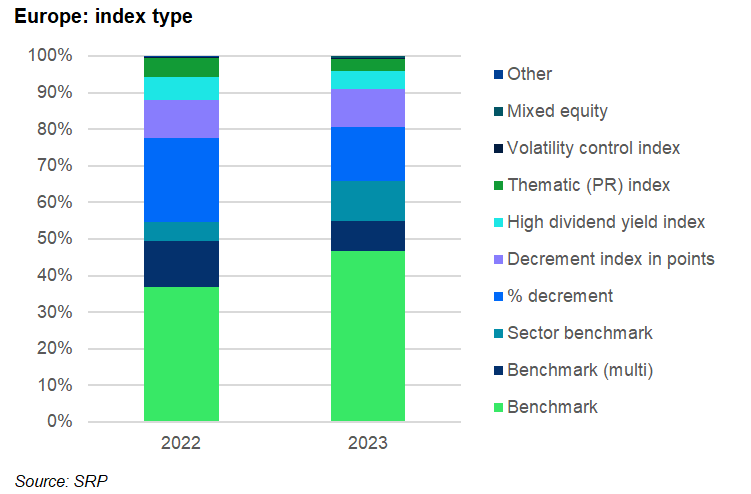
In terms of index type, the industry has taken advantage of the rise in interest rates in 2023 and returned to traditional indices – benchmarks like the Eurostoxx 50, as well as industry sector benchmarks around the three sectors prone to benefiting from rising rates and inflation (e.g. energy, banking, basic resources).
On the flip side, we have observed significantly weaker use of indices with synthetic dividend (decrement). Their sales volumes fell 30% in 2023, while their market share shrank to 25% of the total index-linked offering (down from 33% in 2022).
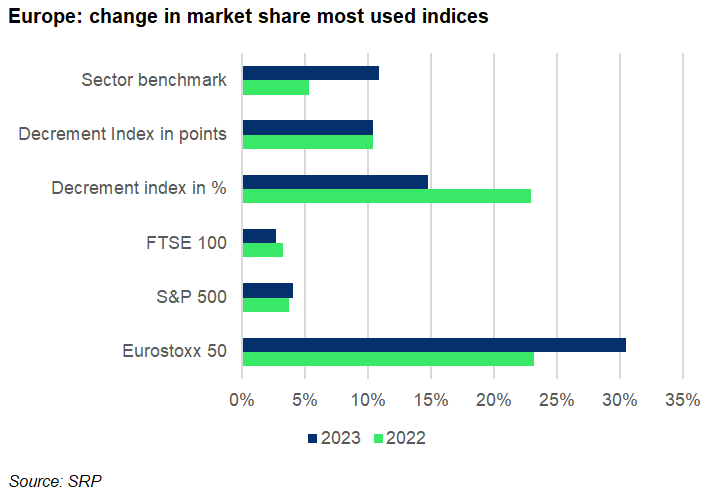
As is observable from the chart above, decrement indices deducting the dividend as a fixed percentage have been more impacted from the decrease, down 40% YoY, and with a share out of the index mix, reduced by eight percent.
Notably, the market share of decrement indices, deducting the dividend in terms of index basis points, remained unchanged YoY. A reason for this is increasing demand for decrement indices, replicating the performance of a single share by reinvesting the gross dividends paid by the stock and detaching a fixed dividend in points.
Using these indices makes it possible to set the level of dividends typically at a level in line with historical dividends, to alleviate the trading burden and obtain a significant pick up on the pricing compared to an investment in the share itself. There has been increasing demand with private banks, financial advisers or insurance companies for this type of index. The longer the maturity, the more interesting the pick up because the forward differential increases.
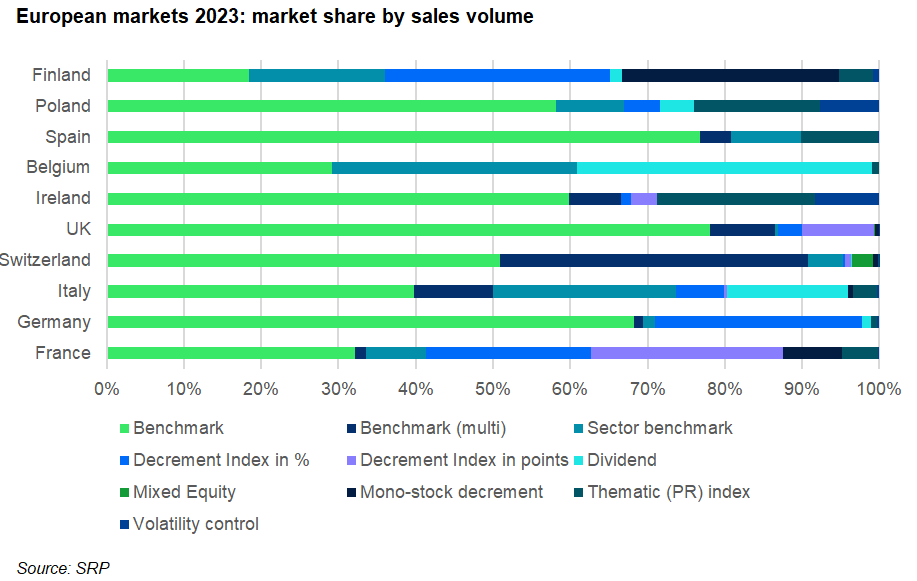
The chart above shows the mix of index underlying types for several market offer jurisdictions.
Classic benchmark indices have consistently represented the biggest market share across the jurisdictions, somewhat less visible in markets like France and Finland. In Switzerland, the 40% share of products linked to multiple benchmarks is notable.
France remains by far the main market for decrement indices due to its bias towards long-term structured products, eg in the life insurance wrapper, for which these indices are most suitable.
Germany and to some extent Italy are also important markets for decrement indices but not Switzerland, where the products’ average investment term is short and decrement indices do not really help to improve the coupon or protection barrier.
Beyond France, decrement indices replicating a single share have been increasingly used in Finland with iEdge Fortum Oyj Decrement 0.9 EUR GTR Series 2 Index the most popular.
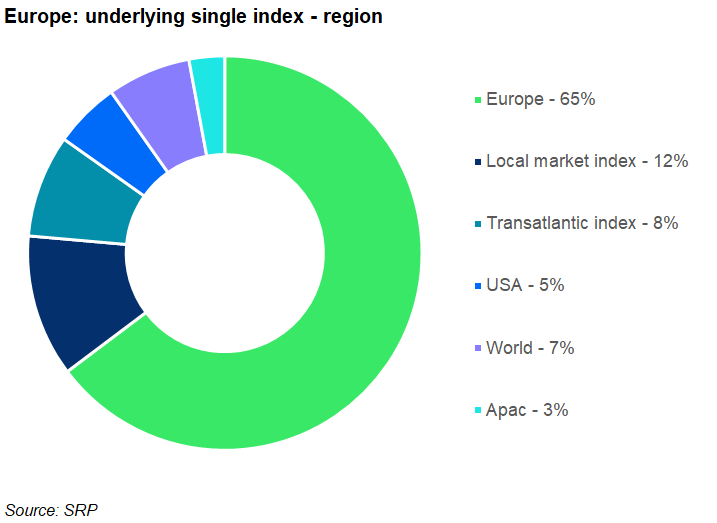
In terms of regional exposure, just above three quarters of the notional has been linked to Europe-based equities, 12% of which gives access to local markets. In this latter group, products linked to the FTSE 100 accounted for 25% of the notional, followed by FTSE MIB with 20%.
iEdge ESG Transatlantic SDG 50 EW Decrement 5% NTR Index and Solactive Transatlantic Biodiversity Screened 150 CW Decrement 50 Index claimed 21% and 12%, respectively, from the geographically weighted ‘Transatlantic’ indices which offer exposure to both European and US stocks. The group represent eight percent of the index mix in terms of equities domicile.
A further five percent of the index-linked products target US equities, among which 78% linked to the S&P 500.
Finally, the MSCI World Climate Change ESG Select 4.5% Decrement EUR Index represented 41% of the indices with global exposure.
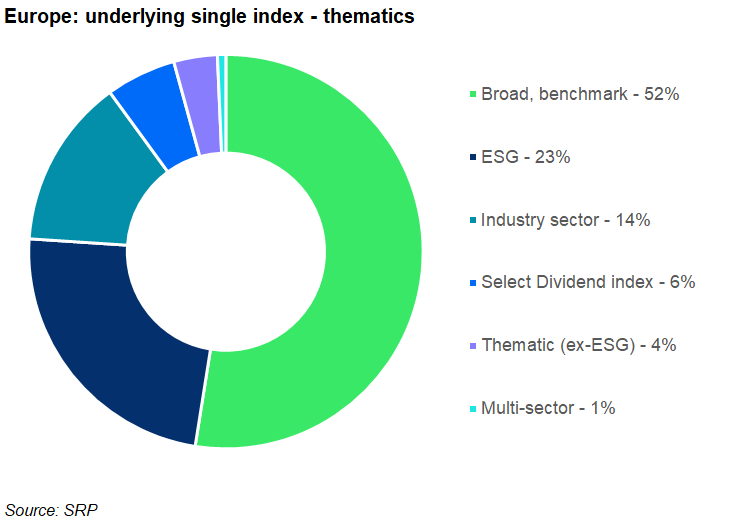
In terms of investment thematics, just above half of the notional was linked to broad market indices, of which 61% linked to the Eurostoxx 50.
Sustainability remained the most popular thematic with index-linked products although the US$10 billion in sales volumes collected by environment, social and governance (ESG) index-linked products in 2023 was a 33% decrease compared to 2022 when US$15.1 billion was collected. Here again, the MSCI World Climate Change ESG Select 4.5% Decrement EUR Index was the most popular index in this group followed by the iEdge ESG Transatlantic SDG 50 EW Decrement 5% NTR Index.
Industry sector index-linked products with strong bias (above 60%) towards the financial sector claimed 14% of index-linked products’ notional.
Main image: Weyo/Adobe Stock.
Do you have a confidential story, tip or comment you’d like to share? Write to info@structuredretailproducts.com.

