
Structured products sold in Canada between 2015 and 2019 averaged a nearly five percent annualised return with only one percent scoring negatively, according to SRP research covering the last five years.
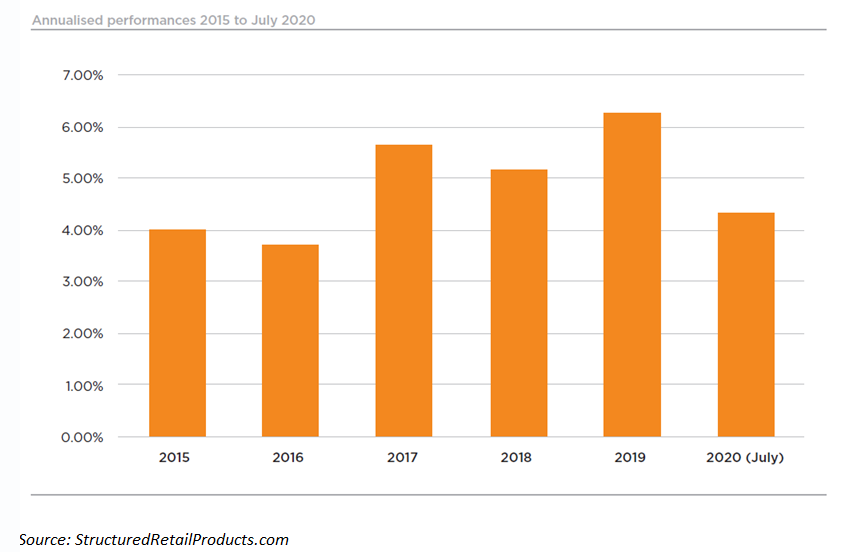
Comparisons with the country’s flagship - the S&P TSX 60 Total Return, show that structured products sold to retail investors held their ground even during this year’s market downfall delivering an average performance of 4.35% for 2020 (until July not included); they also outperformed the benchmark as long as it did not increase above eight percent.
According to the analysis, from the total products with a performance*, 90.47% of the products which matured or expired between 2015 and 2019 delivered a positive return at the end of the investment period (2.97 years on average). Positive performances ranged between 0.01% and 50% (annualised) resulting in an average gain of 5.88% per annum – 43% of the products returned upwards of five percent.
In addition, eight percent of the products sampled returned the initial capital invested, while one and a half percent returned less than the initial investment - negative performances ranged between -0.04% pa to -94.19% pa, resulting in an average loss of -10.98% pa.
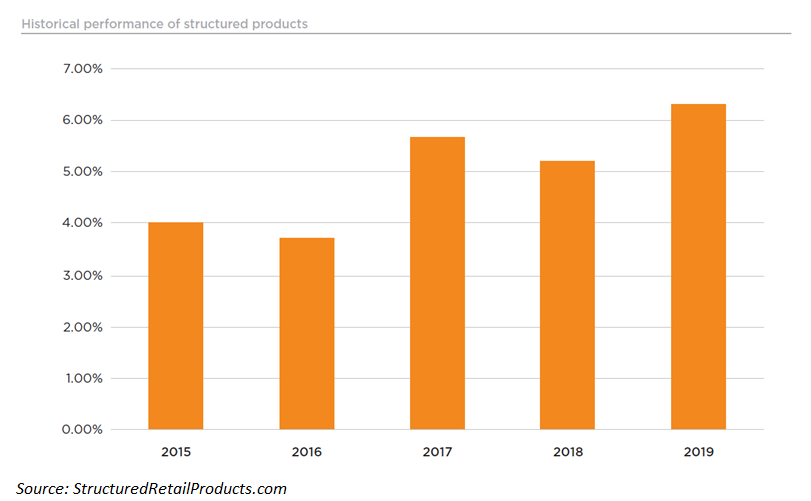
The 2016 Chinese stock market crash and the collapse of oil prices had an impact on the performance of Canadian products resulting in the lowest annualised return of 3.7%.
Historical data shows a strong upward trend in the performance of structured products from 2017 onwards. Coincidently, that period is also marked by a shift from principal protection to principal-at-risk strategies, and the implementation of autocall structures. It was also observed that products with an early redemption feature - autocallables - have significantly improved the average capital return across all payoffs that they have been used in combination with.
Capital protected
Prevailing near-zero interest rates have gradually restricted the issuance of capital-protected structured products.
Of the 12,395 products issued between 2017 and 2019, 4,899 protected at least 90% of the nominal invested, representing approximately 39.5% of the total issuance.
The analysis shows that the share of capital-protected products has been decreased in favour of capital-at-risk structures - in the period between 2014 and 2016, there were 5,535 products with principal-protected products taking just over 50% of total.
The analysis of 3,756 capital-protected products with maturity dates between 1 January 2015 and 31 December 2019 which gathered estimated sales of US$26.67 billion delivered an average annualised return of 2.73% at maturity.
The very low standard deviation of 0.07 unit points indicates a steady return throughout the observation period. Nearly nine percent of the products returned the initial investment and 84% have delivered a return of up to five percent.
According to the analysis, almost 11% (eight percent of sales) of principal-protected products maturing in the period analysed were linked to the S&P/TSX 60 Index making - the mean annualised return of the index was 2.87% which is above the market average of 2.73%.
Products linked to the S&P 500 took three percent of total sales and outperformed the majority of underlyings with an average annualised return of 3.84%.
Capped call structures dominated the sample taking 48.7% of the total with an average term to maturity of 3.6 years and an above average performance - the participation ranged between 50% and 140% of the growth of the underlying with a mean just over 100%. Uncapped calls performed even better with returns of 3.35% pa.
Capital-protected autocalls have delivered an average return of four percent during the period analysed; while portfolio insurance as single payoff has delivered an average performance of 0.36% pa.
Capital-at-risk
According to the SRP analysis, of the 4,423 capital-at-risk structures with maturity dates between 1 January 2015 and 31 December 2019 which gathered an estimated US$13.6bn, delivered an average annualised return of 7.1%.
Ninety-seven percent of the products maturing during this period delivered a positive return while 87% of the products returned five percent or more. Only 2.6% returned less than the initial capital, and less than half of a percent returned just the initial capital at the term of the investment.
Products with negative performance range between -0.05% and -72.2% pa, resulting in an average loss of -11.5% pa. The highest average negative performances were seen in 2016 (-11.4%), 2018 (-13.7%) and the last quarter of 2019 (-13.6%).
Equity single index and equity share baskets dominate the sample making 93% of total products with US$12.2bn of sales. The top three most seen single index underlyings were the S&P/TSX 60 Index (1051) with 5.77% pa, the Eurostoxx 50 (557) with eight percent pa and the S&P/TSX Composite Index Banks (225), which offered an average return of 8.93%.
However, the best performing single underlying was the BMO Equal Weight REITs Index ETF which was featured in 32 products and returned an impressive 16.03% pa.
The analysis found 49 different payoff type combinations in the capital-at-risk product sample with the autocall structure making up 75% of the total with an average return of 8.3% pa.
The best performing payoff within the autocall group had the coupon memory feature and on average delivered 11.91% pa - 99% of the autocallables were paired with a conditional protection at maturity ranging from 10% to 55% with a mean of 27%.
Overall, of the 3,334 autocall products 3,227 or 96.7% terminated early with a mean return of 8.64% pa, giving investors a higher than average return of 6.95% pa within the capital at risk group.
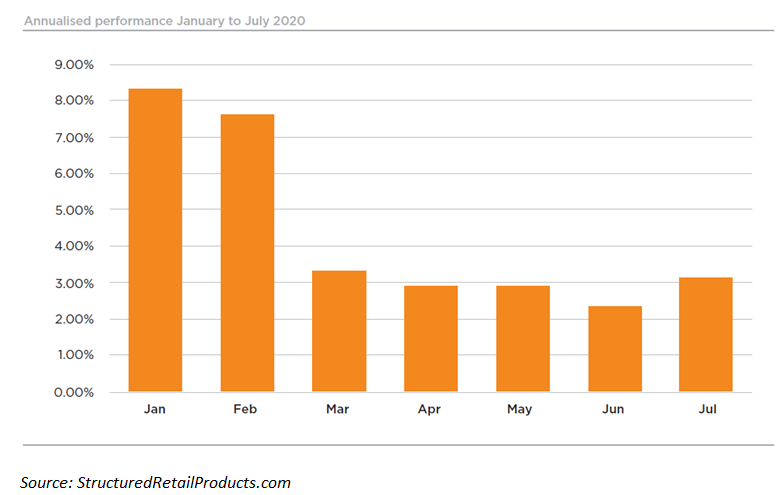
Performance YTD
The average annualised structured product performance fell sharply to 3.3% in March from 7.6% in February and 8.3% in January, and continued to decline reaching its lowest point in June with an average of 2.3% pa. The analysis showed some signs of recovery in July.
Like-for-like calculations showed that whenever the S&P TSX 60 Total Return performance was at its lowest (one percent) structured products had performance three times as high, providing protection and better returns. Less than two percent of products maturing during this period had a negative return whereas eight percent returned the initial capital. In comparison, one percent showed below initial investment returns and eight percent return nothing during 2015 and 2019.
Click in the link to read the full report which includes a separate case study on the performance of autocallable structures maturing during the period analysed.
* Out of the 9,401 structured products that have matured or expired in Canada in the period from 2015 to 2019, SRP has collected or calculated performances for 8,180, or 87%. From those, 4,423 are capital at-risk products, representing 54.2% of all maturing products and 3,757 are capital-protected products, representing 45.8% of all maturing products. The dataset reflects the performances of 74 different payoff structures, as well as over 500 unique sets of underlying assets and 13 issuing manufacturers. SRP’s Canada database covers over 29,000 tranche products, of which 13,652 are live year-to-date.
Image: Lewis Parsons/ Unsplash.