
In the second part of this analysis on the decrement overlay and its use in the structured products market over the last two years, we look at the main providers of indices with decrement features and the most featured decrement underlyings across markets in terms of issuance and sales.
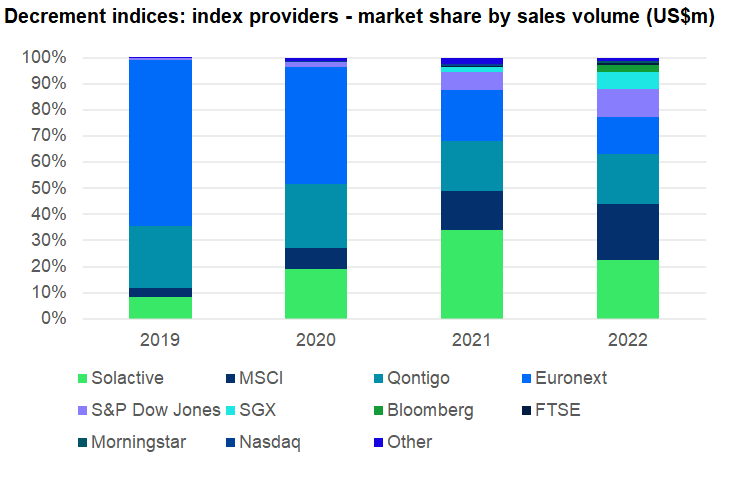
During the reporting period (2019-2022), Euronext, STOXX/Qontigo, Solactive, MSCI, and to a lesser extend S&P Dow Jones, were the main providers for decrement indices, with SGX, Bloomberg and Morningstar as new entrants.
Euronext captured 64% of the market in 2019, when its decrement indices were used in 230 products that sold an estimated US$4.7 billion across eight jurisdictions, but mostly in France (207 products). The following years, its sales volumes remained roughly the same, with the exception of 2022 (US$3.1 billion), although the company’s market share decreased due to increased competition (2022: 14%).
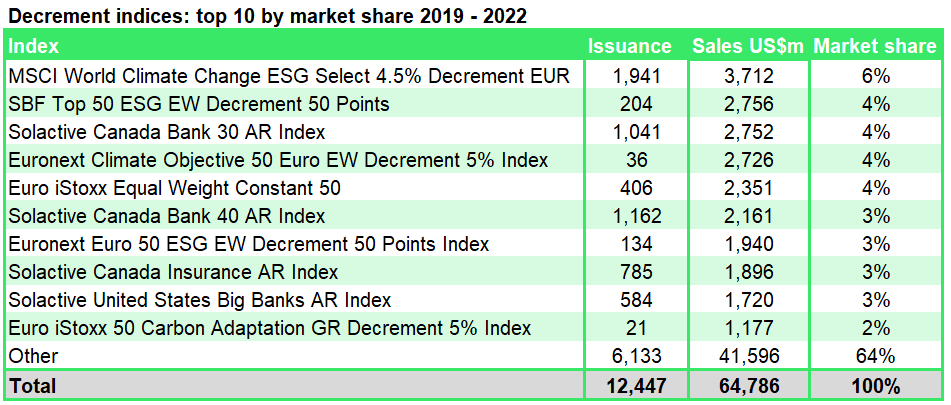
Fifty-seven Euronext decrement indices were used as the underlying for 895 structured products in the period 2019-2022. They included the Euronext Climate Objective 50 Euro EW Decrement 5% Index (US$2.7 billion from 36 products), SBF Top 50 ESG EW Decrement 50 Points (US$2.6 billion from 204 products), and Euronext Euro 50 ESG EW Decrement 50 Points Index (US$1.9 billion from 134 products). The former was used by Natixis only while the other two were exclusively used for products issued via Société Générale.
STOXX/Qontigo’s market share peaked in 2020 at 24% but the company achieved its highest sales a year later when the 530 products linked to its decrement indices gathered an estimated US$4.9 billion. During 2019-2022, its products were sold across 19 different markets, with France once again collecting the highest sales (US$10.3 billion), followed by Italy (US$2.6 billion), and, at some distance, Spain (US$115m).
During the period, STOXX/Qontigo’s flagship decrement indices included the Euro iStoxx Equal Weight Constant 50 (US$2.3 billion from 410 products), which was licensed to Société Générale, and Euro iStoxx 50 Carbon Adaptation GR Decrement 5% Index, which was used by Crédit Agricole in France and by Unicredit in Italy.
Solactive reached its highest market share, at 34%, in 2021 when 2,800 products tied to its decrement indices sold an estimated US$8.6 billion. In 2022, its sales dropped to a still reasonable US$5.1 billion (23% market share).
The German company differs from its competitors in the fact that its focus is very much on the Canadian market, where more than 5,300 products worth an estimated US12.2 billion were linked to its indices between 2019-2022. Solactive’s main indices in Canada were the Solactive Canada Bank 30 AR and Solactive Canada Bank 40 AR indices, with combined sales of just under US$5 billion, as well as the Solactive Canada Insurance AR Index (US$1.9 billion).
In France, its second market behind Canada, the Solactive France 40 Equal Weight NTR 5% AR Index (US$675m) and Solactive Transatlantique 5% AR Index (US$285m) were popular options for investors while in Italy the Solactive US Pharma 10% Risk Control 3% Decrement Net EUR Index accumulated the highest sales (US$130m).
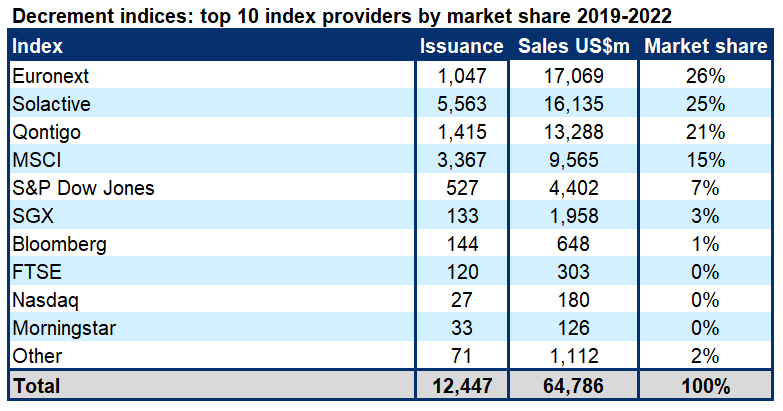
MSCI steadily increased its market share from 3.3% in 2019 to 21% in 2022, when it collected US$4.8 billion from 1,635 products. Its main market, certainly by issuance, was Germany, where it achieved sales of US$5.5 billion from 3,188 products between 2019-2022, although in France, where it sold US$3.4 billion from 110 products, average tickets were much higher.
In Germany, its most popular index was the MSCI World Climate Change ESG Select 4.5% Decrement EUR Index (US$3.7 billion from 1,950 products), which was exclusively licensed to Deka Bank, while there was also demand for MSCI Germany Climate Change ESG Select 4% Index (US$700m) and MSCI EMU Climate Change ESG Select 4% Decrement Index (US$450m).
The MSCI Europe Select Green 50 5% Decrement Index (US$1 billion) and MSCI France Select ESG 30 5% Decrement Net Index (US$715m) were the preferred option for the French investor, while MSCI decrement indices were also seen in Belgium, Italy, Finland, and even China (MSCI World ESG Screened 5% Risk Control Index).
SGX was the calculator and publisher for the iEdge indices, which were licensed to Natixis. They were first seen as the underlying for structured products end-2020 and by 2022 their market share was 6.5%. In total, 106 products worth an estimated US$1.9 billion were linked to the iEdge indices, including 101 that were issued in France, with the remaining five targeted at investors in Finland. At US$975m, halve of the total volumes were invested in nine products linked to the iEdge ESG Transatlantic Water EW 50 Decrement 5% NTR Index.
Bloomberg decrement indices made their first appearance in January 2022 on the SRP database, and by the end of the year they were used across 144 products worth an estimated US$650m (2.9% market share). Again, France was the main market (US$595m from 136 products), whilst there was also activity in Italy (US$57m) and Finland (US$2.5m). Its most used index was the Bloomberg Luxury 2021 Decrement 50 Point EUR Index, which gathered US$215m from 47 products.
FTSE Russell’s presence was limited to the UK and France. In the UK, the bulk of its volumes came from the FTSE Custom 100 Synthetic 3.5% Fixed Dividend Index (US$115m) and, to a lesser extent, FTSE 100 Equally Weighted 45 Point Decrement Index (US$20m), while the FTSE Transatlantic EW Decrement 50 Points TR Index (US$80m) and FTSE France 40 Low Carbon ESG Screened Decrement 50 Points Index (US$65m) were its main indices in the French market.
Morningstar, which, like Bloomberg, made its first appearance in 2022, saw five of its decrement indices used in 33 products across France, Finland and Sweden. Of these, products linked to the Morningstar DM Europe Large-Mid Oil & Gas Decrement 50 Point Index and Morningstar Eurozone 30 Basic Resources Banks Energy Decrement 50 GR EUR Index were the most popular, selling US$60m and US50m, respectively.
Nasdaq’s decrement indices were limited to Nasdaq Yewno Global Innovative Tech Ex Idx EUR ER 5% Index, which was seen in 27 products sold across six different jurisdictions between June 2020 and September 2022. Additionally, its Nasdaq 100 Total Return 2% Decrement Index was used as part of a basket, together with Russell 2000 2% Decrement Index and S&P 500 3% Decrement TR Index, in five products targeted at investors in the US.
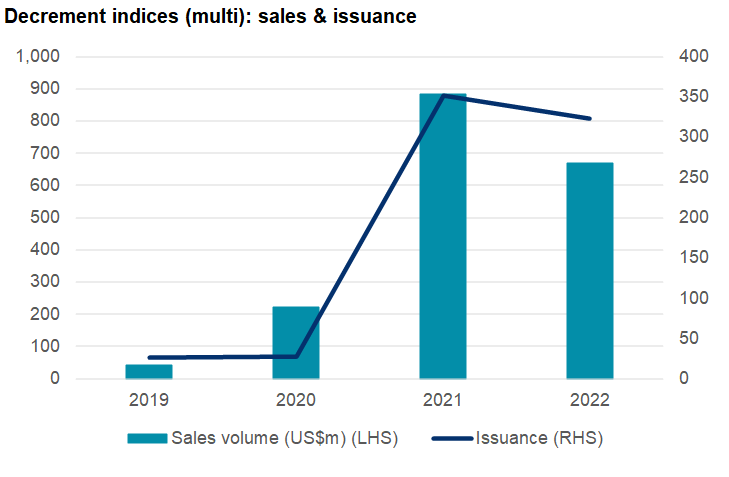
Multi indices
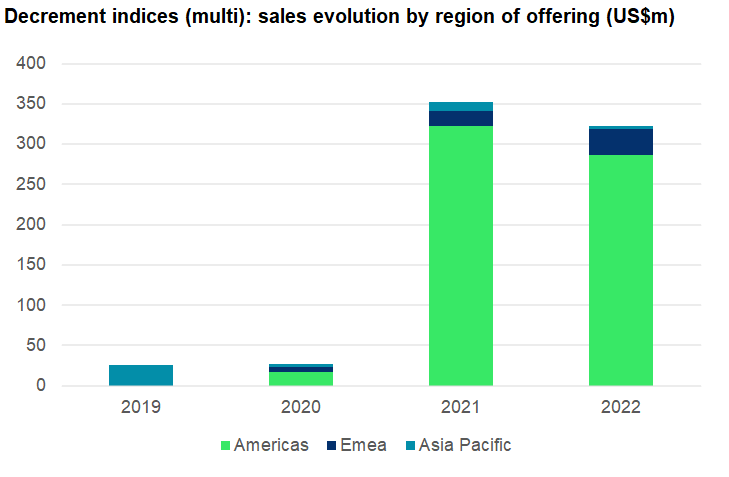
Volumes invested in structured products linked to a basket of decrement indices were much lower compared to those of their single index counterparts (2019-2022: US$1.8 billion vs US$64.8 billion).
Some US$668m was invested in structured products linked to a decrement basket in 2022 – down 24% YoY but a two-fold and 15-fold increase, respectively, compared to 2020 and 2019.
Issuance, at 323 in 2022, remained stable YoY (2021: 352) but the increase in issuance compared to 2020 (27 products) and 2019 (26) was significant.
The Americas was very much the dominant region for products linked to a basket of decrement indices, mainly on the back of their success in the Canadian market, where 672 products collected US$1.4 billion between 2019-2022.
The three most used indices in the period were Solactive Canada Insurance AR Index (441 products), Solactive Canada Pipelines AR Index (417), and Solactive Canada Telecommunications AR Index (255).
In the US there was far less appetite (US$3.8m from seven products), while in Emea, which was the main region for products linked to single decrement indices, they gathered sales of a mere US$125m between 2019-2022. Here, three MSCI indices were the most used in a basket: MSCI Europe Top ESG Select 4.5% Decrement Index (14 products), MSCI Europe ESG Leaders 5% Decrement Index (13), and MSCI Switzerland ESG Leaders 5% Decrement Index (13).
Sales in Asia Pacific between 2019-2022, at US$385m, came solely from 54 products sold in the Korean market, where S&P 500 KRW Hedged 2% Decrement Index ER, Euro iStoxx 50 KRW Hedged Decrement 3.5% ER, and S&P 500 80-Point Decrement Hedged Index, were among those the most frequently seen.
*All charts and tables are based on data from SRP.
Main image: S/Adobe Stock
This article is an abstract from the SRP Index Report 2023: Thematic/Decrement indices. The full report is available for download here.
79148; 79144; 79143