
According to the SRP database, product distribution throughout the year rose to 96,443 available instruments, accruing an estimated US$328.57 billion of capital which represents an 8% increase in terms of issuance and a 9% hike with regard to volume amassed compared to the same period of last year.
In line with the 2017 landscape, investment vehicles linked to equities drove the majority of this year’s product issuance. Instruments tied to share and index baskets increased in numbers with 47% and 12%, respectively, thus amassing an estimated extra $17.1 billion of capital, whereas products pegged to their single share and index counterparts each noted a 3% and a 6% drop in quantity, despite their $10.269 billion contribution in volume accrued.
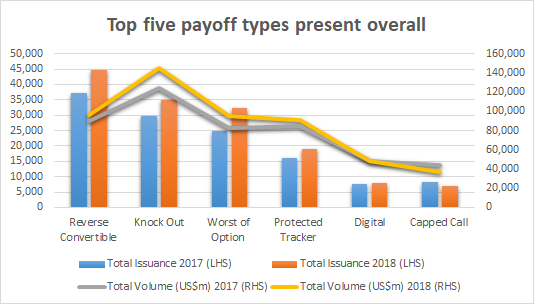
The reverse convertible payoff type was the most prevalent combination choice for issuers in 2018 with 44,606 products, followed by the knock out with 34,841, the worst of option with 32,278, the protected tracker with 19,001 and the digital with 8059 instruments, respectively.
The first four structures not only retained their respective positions among the leading payoff types relative to 2017, but also additionally accumulated an estimated combined total of $45.6 billion through extra 22,881 products, whereas the digital feature displaced the capped call to solidify the five globally dominant payoff favourites in 2018.
Investment vehicles comprising both the reverse convertible and the worst of option payoff profiles moved from third to first place thanks to the 3,183 newly issued products, thus noting an approximately 50% increase in numbers comparative to 2017, or US$2.97 billion in terms of new capital acquired. Extending the historic trend, the European continent, and more specifically Switzerland, hosted nearly 98% of the trading, and hence cemented the payoff type as the first investment choice for Europeans.
Last year’s second best payoff combination - knock out, protected tracker and worst of option - remained subordinate to the leader, but also noted a growth in quantity with extra 1,585 instruments that appended US$6 billion, reaching a total of US$42 billion, the highest volume figure among the top payoff combinations. Despite the steep decline in redeeming equity-linked securities (ELS) towards the end of the year, South Korean investors kept and amplified the 2017 trading momentum in these products, raising nearly US$40 billion of capital.
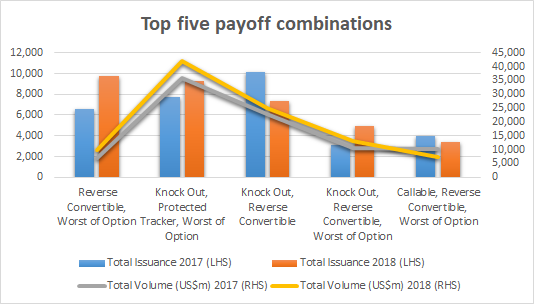
Falling to third place in 2018, the knock out and reverse convertible payoff combination accumulated an additional US$2.25 billion of capital compared to last year, thus crossing the US$25 billion mark, but shrunk in numbers as issuers diminished distribution by 28%. However, investor’s confidence in these products remained high across Europe as German and Austrian financiers solely put the payoffs on second place after the reverse convertible and worst of option combination. American investors, on the other hand, had an extra 712 reverse convertible structures with an auto callable feature at their disposal, but these amassed only half of the capital sold on the old continent.
Reverse convertibles with knock out and worst of option components changed places with similar instruments comprising callable and worst of option features to become fourth in this year’s top five payoff classification due to a 60% spike in issuance, thus reaching nearly 5,000 accessible products. Throughout 2018, Europe and North America were the most active investing regions in the former type with each capitalising on half of the existing distribution palette, whereas payoff combinations with callable and worst of option elements enjoyed success only in Switzerland.
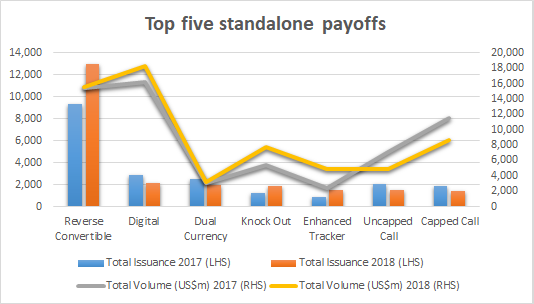
Among financial instruments with a standalone payoff, the reverse convertible type snatched the crown for a second year in a row with 12,952 products in circulation, followed by the digital and the dual currency structures that, in turn, retained their positions relative to 2017 with both payoffs noting a 25% drop in issued quantity.
Products structured with standalone auto callable and enhanced participation features came fourth and fifth, respectively, thus displacing the Uncapped and Capped Call payoff types out of this year’s list, but ultimately contributing 32% less money inflow to the total volume, or US$6 billion of capital.
Following the trend laid out in 2017, single reverse convertibles dominated the European and Asian Pacific markets for structured products thanks to consistent investing from Swiss, German, Austrian and Thai financiers.
South Koreans’ preference for instruments with a Digital payoff recurred with higher intensity throughout 2018, thus occupying the first spot for this type opposed to last year’s Brazil dominance, whereas for a second year in a row, Mexican investors put their confidence primarily in dual currency products. Standalone auto callable instruments were mostly traded in the Asia Pacific region with the Taiwanese market coming on top, followed by a steady international distribution, while structured products offering an enhanced participation in an underlying were the most popular investment choice in the USA.