
Worst-of baskets, single stocks and sector indices dominated the Italian market in the nine months to September 2021.
9Some 1,823 structured products worth an estimated €8 billion (US$9.1 billion) had strike dates in Italy during the first nine months of 2021 – up in issuance but significantly down in sales volumes compared to the prior year period (9M2020: €11.6 billion from 1,473 products).
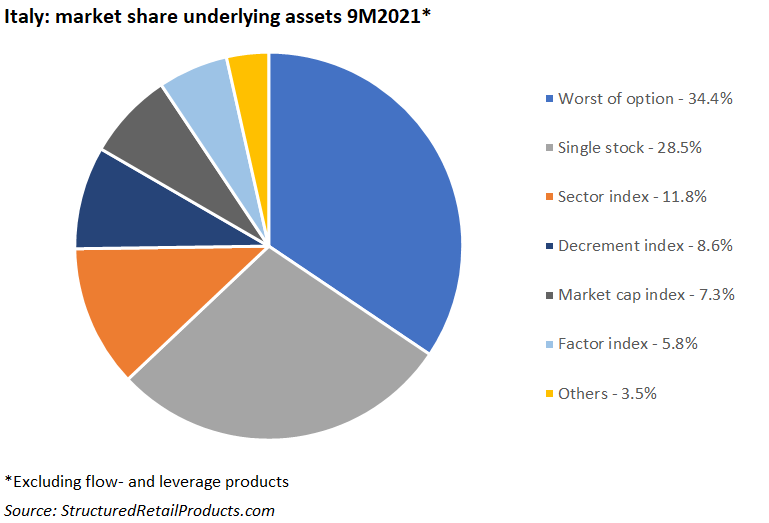
The 1,123 products linked to worst-of baskets attracted sales of approximately €2.8 billion – the equivalent of just over one-third (34%) of the total market. Leonteq and Vontobel, with 358 and 251 products, respectively, were the most active issuers of this product type. Unicredit, with 88 products, was the number one Italian provider.
Structures linked to single stocks collected combined sales of €2.3 billion. Of these, 97% or 446 products, carried the reverse convertible payoff. The most popular single shares were those of local companies such as Intesa Sanpaolo, Eni, and Enel.
Indices from the industry sector captured 11.8% of the market, collecting €950m from 41 products, with the Eurostoxx Banks Index the most frequently used. The best-selling product, Equity Protection con Cedola e Cap was tied to the Eurostoxx Oil & Gas. It was distributed via Banco BPM and sold €132m during its subscription period.
Next were decrement indices, with a 8.6% share of the market (€685m from 39 products). They included. The highest volumes in this segment came from four structures linked to the iStoxx Europe 600 ESG-X NR Decrement 4.75% Index, which sold a combined €130m.
Traditional market cap indices, such as the Eurostoxx 50, S&P 500, and FTSE MIB were also in demand, with 51 products (€580m) issued in the first three quarters.
The 22 products linked to factor indices collected €465m, the vast majority of which came from products linked to the Eurostoxx Select Dividend 30 Index.
The ‘others’ category included products linked to thematic indices, interest rates, credit, exchange-traded funds, FX rates and funds.
Check out the below chart for the preferred underlying assets of the Italian investor.
Main image credit: Jametlene Reskp/Unsplash